Animated maps of nature and climate
These maps follow animals, forests, water and ice. Some show a species spreading: the Asian hornet across Europe since 2004, the Asian tiger mosquito since its first European record in Albania in 1979, and the wolf since about 1970. Others show a loss or a retreat: the Aral Sea since 1960, Arctic and Antarctic sea ice in every year of the satellite record, and the ranges of mammoths and elephants since the last Ice Age.
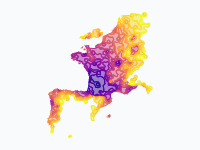
On the hornet and wolf maps, land takes the colour of the year in which the species was first recorded or first settled there, and the oldest ground is the darkest. The sea-ice map puts both poles side by side, with the winter maximum in blue and the summer minimum in white. The forest map shows where Europe's forests stood around 1400, where they were cleared and what grew back. The map of Sweden's deer is a model of a typical year, not tracking data.
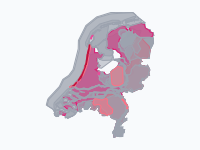
Two maps are about land and water in the Netherlands, and a third (in Dutch) shows where the protected animal species of that country lived. One map sets each country's CO₂ emissions per person against its income per person, from 1850 to 2022, and one shows every offshore wind farm in the North Sea and the Baltic in the year it first fed power to the grid.
13 maps
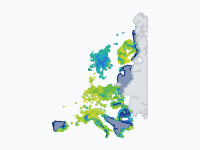
The return of the wolf to Europe, 1970–2026
Where wolves (Canis lupus) live permanently in Europe, coloured by when they first settled there: dark blue = present c. 1970, through blue, cyan and green, to yellow-green = most recent.
Read the article: How the Wolf Walked Back into Western Europe, 1970–2026: An Animated Map
The spread of the Asian hornet across Europe, 2004–2026
The yellow-legged or Asian hornet (Vespa velutina nigrithorax) is a hornet from Asia that preys on honeybees. Genetics point to a single mated queen that reached Lot-et-Garonne in south-west France around 2004…
Read the article: How the Asian Hornet Spread Across Europe, 2004–2026: An Animated Map
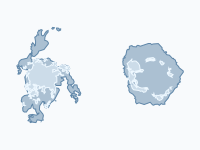
Sea ice at its extremes, 1979–2026
Every winter the seas around the poles freeze, and every summer they thaw again. This map shows both ice caps at their extremes in every year of the satellite record, 1979–2026, as two polar discs side by side: the…
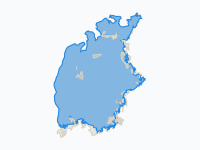
The disappearance of the Aral Sea, 1960–2026
In 1960 the Aral Sea, on the border of Kazakhstan and Uzbekistan, was the fourth-largest lake in the world: about 67,600 km² of brackish water with a fishing fleet, canneries and more than a thousand islands.
Read the article: The Disappearance of the Aral Sea, 1960–2026: An Animated Map
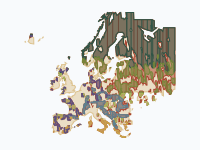
Europe's Forests, 1400–2025
Where Europe's forests stood around 1400, where they were cleared, and what grew back. Greens show forest, coloured by natural forest zone from dark boreal conifers to light broadleaf; blue-green shows planted forest…
Read the article: How Low Europe's Forests Fell, and How They Came Back (1400–2025)
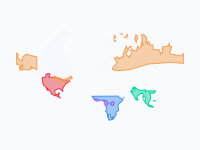
Where elephants and mammoths lived, 21,000 years ago to today
Where elephants and their mammoth cousins lived in the wild, from the peak of the last Ice Age (about 21,000 years ago) to today. Colours show the species: woolly mammoth (orange, extinct about 4,000 years ago)…
Read the article: Where Mammoths and Elephants Lived, from the Ice Age to Today: An Animated Map
Asian tiger mosquito in Europe, region by region, 1979–2026
Region by region, the spread of the Asian tiger mosquito (Aedes albopictus) in Europe, from the first European record in Albania (1979) to 2026.
Read the article: How the Asian Tiger Mosquito Spread Across Europe, 1979–2026: An Animated Map
One year, July to June
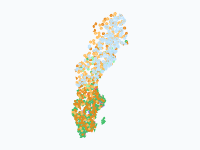
Sweden's deer on the move: one year of migrations
A typical year for Sweden's deer family, shown as one year from July to June: reindeer (pale blue), moose (orange; elk in British English), roe deer (green), red deer (red) and fallow deer (purple).
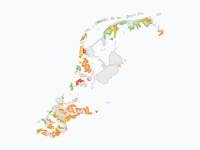
How the Netherlands Rose from the Sea, 500 BC–2026
2,500 years of the Dutch coast: how the peat bogs behind the dunes sank and drowned, how storm floods cut out the Zuiderzee, the Dollard, the Biesbosch and the drowned lands of Zeeland, and how the land was won back…
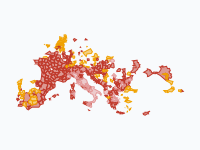
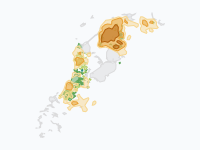
Mills Against the Water: Windmills, Pumping Stations and Floods in the Netherlands, 1400–2026
Six centuries of pumping the Netherlands dry, and of the floods that came anyway. Orange patches are fields of polder windmills: the darker, the more mills per 100 km².
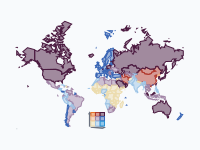
Carbon vs Prosperity: CO2 Emissions and Wealth by Country, 1850–2022
How much carbon does prosperity cost? Each country is coloured by two figures at once: its income per person (the bluer, the richer) and its CO₂ emissions per person (the more orange and red, the more it emits).
Read the article: Carbon vs Prosperity, 1850–2022: An Animated Map of CO₂ Emissions and Wealth
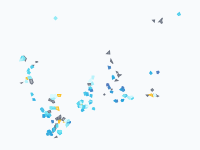
Offshore wind in the North Sea and Baltic, 1991–2026
Every offshore wind farm in the North Sea and the Baltic, shown in the year it first fed power to the grid, from Vindeby's eleven small turbines off Lolland in 1991 to the gigawatt farms of today.
Beschermde diersoorten in Nederland, 1880–2026
Waar leefden 29 wettelijk beschermde (en deels uitgestorven) diersoorten in Nederland, van de eerste beschermingswet in 1880 tot nu? LEESWIJZER • Grijs = de soort komt er voor, maar is op dat moment niet wettelijk…
Read the article: Protected Animals in the Netherlands, 1880–2026: An Animated Map
Make your own animated map
Pick a region and two years, and watch the borders of that time move. You need no account to try it.
Create a map