Five Megawatts off Lolland
In 1991 eleven small turbines started turning in shallow water off the Danish island of Lolland, 450 kW each, 4.95 MW in all: Vindeby, the first offshore wind farm in the world. By October 2026 the farms in the North Sea and the Baltic add up to 41.3 GW, more than eight thousand Vindebys, and a single turbine of Poland's first farm has three times the capacity of the whole of it.
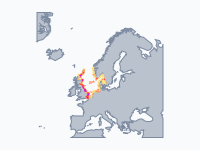
The map adds every farm in the year it first fed power to the grid and colours it by that year, dark blue for the pioneers and pale blue for this decade, while the bar at the top keeps count. It also shows the order in which countries took the lead, and the years when the money stopped adding up.
Denmark's Head Start, 1991–2009
For its first ten years offshore wind was a Danish experiment in sheltered water. Tunø Knob (ten 500 kW turbines in the Kattegat) followed Vindeby in 1995, and in 2000 twenty 2 MW turbines went up on the Middelgrunden shoal just outside Copenhagen harbour, half of them owned by a cooperative of local people. The step to industry came in 2002 with Horns Rev 1: 80 turbines and 160 MW in the open North Sea off the west coast of Jutland, the first large offshore farm. A year later Nysted (165.6 MW) went up off Lolland, and at the end of 2005 Denmark held 406 of the 583 MW on the map.
The others started small. Sweden put five 550 kW turbines off Gotland (Bockstigen, 1998) and later built Lillgrund (110 MW, 2007) in the Øresund. Britain's first were two 2 MW turbines off Blyth in Northumberland in December 2000, followed by Scroby Sands (2004) and Kentish Flats (2005). The Netherlands followed with Egmond aan Zee (first power 2006) and Prinses Amalia (2007), Germany with the alpha ventus test field 45 km north of Borkum (2009) and Belgium with the first turbines on the Thornton Bank (2009). In 2008 the two seas together passed 1 GW.
Britain, Then Germany, 2010–2020
In 2010 the total doubled in a single year, from 1.6 to 3.2 GW, as Greater Gabbard (504 MW) and Thanet (300 MW) off the English east coast and Germany's BARD Offshore 1 (400 MW) started feeding power. Britain passed Denmark that year and stayed ahead until 2014, helped along by the London Array in the Thames estuary: 175 turbines and 630 MW, the largest offshore farm in the world from 2013 until 2018.
Then came the German rush. In 2014 and 2015 farm after farm appeared in the German Bight, many of them far out at sea around Heligoland and north of Borkum: Nordsee Ost, Meerwind, DanTysk, Global Tech I, Borkum Riffgrund 1, Amrumbank West, ten new farms in 2015 alone. From 2015 to 2020 Germany had more capacity in the North Sea and Baltic than Britain (7.6 against 7.2 GW in 2020). The comparison is lopsided, because the map leaves out the Irish Sea, and with Walney, Gwynt y Môr and the other west coast farms the UK's national total stayed larger throughout. Britain went back in front in these waters in 2021, when Hornsea 2 (1.39 GW) and Triton Knoll (857 MW) came on line; two years earlier its neighbour Hornsea One had become the first farm over a gigawatt, 174 turbines 120 km off Yorkshire.
The smaller countries came in bursts. The Netherlands added Gemini (600 MW) in 2016, Borssele (1.5 GW in four sites) in 2020 and Hollandse Kust Zuid in 2022. Belgium filled its small zone off Zeebrugge between 2009 and 2020 and has stood at 2.26 GW since. The total passed 10 GW in 2016, 20 GW in 2020 and 30 GW in 2023.
The Zero-Subsidy Turn
Until 2016 every farm on the map was built with public support of one kind or another: feed-in tariffs, green certificates or guaranteed prices. In April 2017 the first German offshore auction ended with something nobody had seen before: EnBW bid zero for its 900 MW He Dreiht site, and DONG Energy (now Ørsted) bid zero for two 240 MW sites, OWP West and Borkum Riffgrund West 2. The bidders would live on the wholesale price alone. EnBW said its bid assumed the bigger turbines that were expected in the coming years, and in Germany the grid operator paid for the cable to shore. A year later, in March 2018, the Netherlands held a tender designed for bids without subsidy from the start, and Vattenfall won the first two sites of Hollandse Kust Zuid.
Hollandse Kust Zuid became the first subsidy-free farm to be built: 139 turbines of 11 MW (1.5 GW) off The Hague and Zandvoort, first power in August 2022, opened in September 2023. The German zero bids took longer. On the map they appear together in the caption for 2025, 'He Dreiht, Borkum Riffgrund 3': EnBW's farm, now 64 turbines of 15 MW (960 MW), first fed power in November 2025, and Ørsted's Borkum Riffgrund 3, which joins the two zero bids of 2017 with a third site won in 2018, followed in December (913 MW).
The Auctions Nobody Bid In, 2023–2025
By then the arithmetic had turned. Turbines, steel, ships and loans had all become more expensive, and prices set in the cheap years no longer paid for a farm. The UK auction of September 2023 drew no offshore wind bids at all: the ceiling was 44 pounds per MWh in 2012 prices. Denmark offered three North Sea sites of at least 3 GW without state support and had received no bid when the deadline passed on 5 December 2024 (the pin in the North Sea off Jutland). Germany's auction for 2.5 GW at the sites N-10.1 and N-10.2 ended on 1 August 2025 without a single bid, the first time that had happened there.
Governments went back to paying for certainty. Britain raised its ceiling and contracted about 5.3 GW of offshore wind in September 2024, and Denmark opened a new tender in November 2025 with two-sided contracts for difference, which pay the farm when power prices are low and take money back when they are high. None of this shows on the map yet, which counts farms feeding power: the 2026 frame, with Sofia, Dogger Bank B, Thor and Poland's Baltic Power, is the biggest single year so far, but those farms were bid for years ago, and the German sites that drew no bids were not due before 2030 and 2031. The last frame, a snapshot of early November 2026, shows 11.3 GW under construction (amber), led by Hornsea 3 at 2.96 GW, and about 42 GW approved but not built (grey), against a promise made at Ostend in 2023 of 120 GW in the North Seas by 2030.
How to Read the Map
Each colour is a year of first power, from dark blue (1991) to pale blue (2026); a farm keeps its colour after it appears, so the oldest farms stay dark among the new ones. The caption of every keyframe names the largest farm that started that year and the running total, and the bar at the top counts installed megawatts by the same rule: a farm counts at its full size from its year of first power, and dismantled farms are taken off again, so Vindeby vanishes in 2017 and Blyth in 2019. Because large farms take a year or two to finish, these totals run ahead of official statistics (32.8 GW against about 31 GW counted by WindEurope at the end of 2024).
Farm areas are the licensed sites, which are only a few kilometres across on a map 2,000 km wide. So that every farm shows at this scale, none is drawn smaller than 10 km across, farms above about 260 MW get 0.3 km² per MW (a rounded outline around the site), and a faint ring in the farm's own colour widens small farms to about 26 km. The largest farms, such as Hornsea and Dogger Bank, keep their true outline. Zoom in and the rings separate from the farms inside them. The full pins mark firsts and turning points (Horns Rev 1, London Array, Hornsea One, Kriegers Flak, Hollandse Kust Zuid, the failed Danish tender); the small dots are country and technology firsts, such as Hywind Scotland, the first floating farm (2017).
How the Map Was Made
The outlines come from EMODnet Human Activities (offshore wind farms, CC BY 4.0) and the sea areas from Marine Regions. EMODnet's dates, sizes and statuses proved unreliable (duplicates, stale statuses, no Norwegian farms), so every farm was checked one by one against operators, energy agencies and trade press for its year of first power, its size and whether it still stands, and the totals were compared with the annual offshore statistics of WindEurope and EWEA. The map covers the North Sea with the Skagerrak and Kattegat, and the Baltic with its gulfs; farms in the Irish Sea, the Channel and on the Atlantic coast are left out, as are inland farms, single-turbine prototypes and farms north of 63°N in the Bay of Bothnia. Data run to 31 October 2026 for farms feeding power; the farms being built or approved change every few months.
Chronological Timeline
- 1991 — Vindeby, eleven 450 kW turbines off Lolland: 5 MW
- 1995 — Tunø Knob in the Kattegat
- 1998 — Bockstigen, Sweden's first offshore farm
- 2000 — Middelgrunden off Copenhagen; Blyth, the UK's first
- 2002 — Horns Rev 1, the first large farm in the open North Sea (160 MW)
- 2006 — Egmond aan Zee, the first Dutch North Sea farm
- 2008 — North Sea and Baltic pass 1 GW
- 2009 — alpha ventus (Germany) and Thornton Bank (Belgium)
- 2010 — Greater Gabbard and Thanet; Britain overtakes Denmark
- 2012–2013 — London Array, 630 MW, the world's largest until 2018
- 2015 — Ten new farms, most in the German Bight; Germany leads in these waters
- 2016 — 10 GW passed
- April 2017 — First zero-subsidy bids in a German auction
- October 2017 — Hywind Scotland, the first floating wind farm
- March 2018 — Vattenfall wins the first Dutch tender without subsidy
- 2019 — Hornsea One, the first farm over 1 GW
- 2020 — Kriegers Flak links Denmark and Germany; 20 GW passed
- 2021 — Hornsea 2; Britain back in front
- September 2023 — Hollandse Kust Zuid opens; UK auction draws no offshore bids
- December 2024 — Denmark's 3 GW North Sea tender draws no bids
- August 2025 — Germany's 2.5 GW auction draws no bids
- November–December 2025 — He Dreiht and Borkum Riffgrund 3, the 2017 zero bids, feed power
- July 2026 — Baltic Power, Poland's first offshore farm
- October 2026 — 41.3 GW
Watch the first eighteen years, when a handful of Danish dots are almost the whole industry, then slow down between 2014 and 2016 as the German Bight fills up.
Explore the full interactive map →Frequently asked questions
- What was the world's first offshore wind farm?
- Vindeby, off the north coast of the Danish island of Lolland, which started feeding power in 1991. It had eleven Bonus turbines of 450 kW each, 4.95 MW in all, and ran until it was dismantled in 2017. A single turbine of Poland's Baltic Power farm (15 MW, first power in 2026) has three times the capacity of the whole of Vindeby.
- How much offshore wind capacity is there in the North Sea and the Baltic?
- Adding up every farm in the two seas, counted at full size from its first year of power, gives 34.7 GW at the end of 2025 and 41.3 GW by October 2026. Official statistics count only what is connected and finished, so they are lower: WindEurope counted about 31 GW in these waters at the end of 2024, where the same farm-by-farm sum gives 32.8 GW. A further 11.3 GW was under construction in early November 2026 and about 42 GW had been approved but not yet built.
- Which country has the most offshore wind in the North Sea and Baltic?
- The United Kingdom, with 16.6 GW in these two seas by October 2026, ahead of Germany (11.8 GW), the Netherlands (5.5 GW), Denmark (3.7 GW), Belgium (2.3 GW) and Poland (1.1 GW). Denmark led until 2009, Britain from 2010 to 2014, and Germany from 2015 to 2020 if only the North Sea and Baltic are counted; Britain went back in front in 2021. Counting its Irish Sea farms as well, the UK has had the larger national total throughout.
- What was the first offshore wind farm built without subsidy?
- Hollandse Kust Zuid off the Dutch coast, 139 turbines of 11 MW (1.5 GW). Vattenfall won its first two sites in March 2018 in the Netherlands' first tender designed for bids without subsidy; first power came in August 2022 and it opened in September 2023. The first zero-subsidy bids had come a year earlier, in the German auction of April 2017, for EnBW's He Dreiht and two Ørsted sites that became part of Borkum Riffgrund 3; both farms first fed power at the end of 2025.
- Why did offshore wind auctions fail in 2023–2025?
- Because the price on offer no longer covered the cost of building. The UK auction of September 2023 drew no offshore wind bids at a ceiling of 44 pounds per MWh (in 2012 prices); Denmark's tender for three North Sea sites of at least 3 GW, offered without state support, had no bidders by its deadline of 5 December 2024; and Germany's auction for 2.5 GW at the sites N-10.1 and N-10.2 ended without a bid on 1 August 2025, the first time that had happened there. Britain raised the price and contracted about 5.3 GW in 2024, and Denmark went back to two-sided contracts for difference in a new tender opened in November 2025.
- Is there an animated map of offshore wind farms in the North Sea?
- Yes. Moving Polygons has a free animated map, Offshore wind in the North Sea and Baltic, 1991–2026, that adds every farm in the year it first fed power, coloured from dark blue (oldest) to pale blue (newest), with a running capacity bar and pins for the firsts and setbacks. The last frame shows the farms under construction and approved in November 2026. You can watch it, embed it on your own website or export it as an animated GIF.
Text version of the map (timeline, layers and events): Markdown