Rich Meant Dark, Until It Didn't
In 1850 the world emitted about 0.2 billion tonnes of CO₂ from fossil fuels, and Britain alone accounted for 62% of it. In 2022 the world emitted 37.5 billion tonnes. Between those two numbers lies the whole of modern prosperity: every country that became rich did so on coal, oil and gas. This map asks what that link looks like country by country, and whether it still holds.
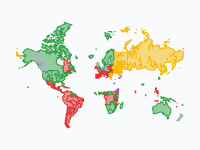
Each country is coloured by two figures at once: its income per person (the bluer, the richer) and its CO₂ emissions per person (the more orange and red, the more it emits). A country that is rich and emits a lot is dark plum; one that is rich and emits moderately is blue. For 130 years the map darkens as it gets richer. After 1980 the two come apart: in 2022, 37 of the 59 rich countries emit less than 8 tonnes a person, and Britain is back at the level of 1850 at nine times the income.
Coal: Britain First, Then America (1850–1940)
In 1850 there are figures for 18 countries, and only two of them emit more than 2 tonnes of CO₂ a person: Britain (4.5 tonnes, on an income of about $4,300) and Belgium (2.1 tonnes). Britain passes 8 tonnes in 1873 and is last above it in 2010. The United States follows faster than anyone: 0.8 tonnes a person in 1850, 8.9 tonnes in 1900 and 14.2 tonnes in 1910, by then well ahead of Britain's 10.5 tonnes, on an income of $9,600. In total emissions it passes Britain in 1890 and stays the world's largest emitter until China overtakes it in 2006.
Germany, France, Canada and the Low Countries industrialise on coal as well, but more slowly: Germany reaches 5.9 tonnes a person in 1900 and passes 8 tonnes only in 1940, in a war economy. The First World War leaves Germany and Austria below $5,000 a person again in 1920, and through the 1920s the world average is stuck near 1.9 tonnes. In all these years no country on the map is rich by the measure used here ($20,000 a person in 2011 prices). The coal countries are brick red: middle income, high emissions.
Oil and the Long Boom (1950–1980)
From 1950 there are figures for 139 countries, and 107 of them are poor with low emissions: nearly all of Africa, Asia and Latin America. The only rich countries are two oil states, Qatar and Kuwait. The United States emits 16.5 tonnes a person at $15,200 and produces 43% of the world's CO₂; it passes $20,000 in 1965, the first large country that is both rich and a high emitter. Western Europe and Japan follow during the long boom, now on oil as much as coal. In 1970 seven countries are rich and above 8 tonnes, in 1975 eleven, and in 1980 seventeen of the 23 rich countries. Only six are rich and below that line in 1980, among them Switzerland, Norway and Italy.
The Eastern Bloc reaches the same emissions by another road. Russia emits 15.0 tonnes a person in 1980 on an income of $12,200, Poland 12.9 tonnes on $9,100 and Czechia 18.0 tonnes on $12,300: coal and heavy industry, without the wealth. On the map the bloc is brick red from Czechia to Kazakhstan.
First Cracks, a Collapse and New Climbers (1980–2010)
The first cracks follow the oil shocks. In October 1973 Arab oil producers cut their exports and the oil price roughly quadruples. France answers with dozens of nuclear reactors and goes from 9.6 tonnes a person in 1980 to 7.4 tonnes in 1985; Sweden and Japan drop below 8 tonnes in the same years, although Japan climbs back above it by 1990. They are the first large rich countries to turn blue.
The second break is a collapse. When the Soviet Union is dissolved in December 1991, heavy industry goes down with the planned economy: Russia falls from 17.1 tonnes a person in 1990 to 11.0 tonnes in 1995, while income drops from $12,400 to $8,600, and Ukraine falls from 13.6 tonnes to 7.6 tonnes. Emissions fell there because people got poorer, not because the economy got cleaner.
Meanwhile new countries climb the old path. South Korea and Taiwan are rich and above 8 tonnes by 2000. China, at 2.9 tonnes a person in 2000, joins the World Trade Organization in December 2001 and reaches 6.4 tonnes by 2010. The Kyoto Protocol of 1997, the first treaty with binding targets for industrialised countries, enters into force in 2005 without the United States. The number of rich countries above 8 tonnes keeps rising and peaks at 34 in 2010.
Coming Apart (2010–2022)
After 2010 the dark plum retreats. Britain, Denmark and Austria are below 8 tonnes by 2015, Germany and the Netherlands by 2020. In 2022, 37 of the 59 rich countries are below the line, among them Britain (4.6 tonnes), France (4.4), Sweden (3.6), the Netherlands (7.1) and, by a hair, Germany. The other 22 are still above it: the United States (14.8 tonnes), Australia (14.8), Canada (14.1), Japan, South Korea, Russia, Poland and the Gulf states, with Saudi Arabia at 19.0 tonnes and Qatar at 35.8. Britain is the clearest case of all: its 4.6 tonnes a person in 2022 is about what it emitted in 1850, at roughly nine times the income. It closed its last coal power station in 2024.
Two cautions belong with that picture. First, the map counts what is emitted inside a country's borders, not what is emitted elsewhere to make the goods it imports. Counted by consumption, Britain emitted 7.3 tonnes a person in 2022 instead of 4.6; that is still well down from 11.6 tonnes in 1990, but the fall is smaller than the map suggests. Second, the world as a whole has not turned. China passes 8 tonnes in 2022 at a middle income of $19,200, more per person than Britain, France or Italy, and produces 31% of the world's CO₂. India is at 2.0 tonnes and rising. World emissions in 2022 are the highest of the whole period.
The arithmetic behind that is simple. Between 1950 and 2022 the world's average income went up five times and its CO₂ per person two times: a dollar of income now takes 0.28 kg of CO₂ instead of 0.71 kg. Prosperity has become much cleaner per dollar, but there are far more dollars and far more people.
How to Read the Map
The block of nine colours in the South Atlantic is the key, and the same nine colours head the legend. To the right is richer: GDP per person under $5,000, $5,000 to $20,000, and over $20,000. Upward is more CO₂ per person: under 2 tonnes, 2 to 8 tonnes, and over 8 tonnes. Cream is poor with low emissions, light blue is middle income with low emissions, mauve is middle income with medium emissions, brick red is middle income with high emissions, blue is rich with medium emissions and dark plum is rich with high emissions. Land without a colour has no figures for that year.
The class limits are the same in every year, so a colour means the same thing in 1850 and in 2022. Hover over a country, or tap it, for its name. The bar at the top shows what the whole world emits in a year, and the pins mark the events behind the changes; click one for its story. Borders are today's, also for the past: Germany is one country throughout and the Soviet republics are shown separately, most of them from 1975, when their own figures begin.
How the Map Was Made
The emissions come from the Global Carbon Budget of the Global Carbon Project: CO₂ from fossil fuels and industry, counted where it is released, without land use and deforestation. Income is GDP per person from the Maddison Project Database 2023 (Jutta Bolt and Jan Luiten van Zanden), in international dollars of 2011, corrected for inflation and purchasing power. Both, and the population figures, were taken from Our World in Data (CC BY 4.0) on 11 November 2026. The consumption-based figures quoted in this article come from the same Global Carbon Budget data.
The map has a frame every ten years from 1850 to 1950, every five years from 1955 to 2020, and one for 2022, the last year with income figures. A year without a GDP figure is interpolated between the surrounding years, which matters before 1950, when many countries have figures for a few benchmark years only. There are figures for 166 countries; Sudan and South Sudan use the income of former Sudan and Northern Cyprus the figures of Cyprus. Islands and city states too small to see at world scale, such as Singapore, Bahrain and Malta, are drawn as discs. Borders are from Natural Earth, simplified.
Chronological Timeline
- 1850 — Figures for 18 countries; Britain emits 4.5 t of CO₂ a person and 62% of the world's total
- 1873 — Britain passes 8 t a person
- 1890 — The United States passes Britain in total emissions
- 1910 — United States: 14.2 t a person on an income of $9,600
- 1920 — After the First World War Germany and Austria are below $5,000 a person again
- 1940 — Germany passes 8 t a person
- 1950 — Figures for 139 countries; 107 are poor with low emissions; Qatar and Kuwait are the only rich ones
- 1965 — The United States passes $20,000 a person
- October 1973 — Oil embargo; the oil price roughly quadruples
- 1980 — 17 of the 23 rich countries emit more than 8 t a person
- 1985 — France, Japan and Sweden are below 8 t
- 1990 — Russia emits 17.1 t a person
- 26 December 1991 — The Soviet Union is dissolved
- 1995 — Russia is down to 11.0 t a person
- 11 December 1997 — The Kyoto Protocol is adopted
- 11 December 2001 — China joins the World Trade Organization
- 16 February 2005 — The Kyoto Protocol enters into force
- 2006 — China passes the United States in total emissions
- 2010 — Peak: 34 rich countries above 8 t a person
- 12 December 2015 — The Paris Agreement is adopted
- 2020 — Pandemic year; Germany and the Netherlands are below 8 t
- 2022 — 37 of the 59 rich countries are below 8 t; China is above it; the world emits 37.5 billion tonnes
Watch the world darken and then come apart in the interactive map, click the pins for the events behind each turn, or embed the map on your own site.
Explore the full interactive map →Frequently asked questions
- Can a country get richer while cutting its CO₂ emissions?
- Yes. Britain emitted 4.6 tonnes of CO₂ a person in 2022, about what it emitted in 1850 (4.5 tonnes), at roughly nine times the income. In 2022, 37 of the 59 rich countries emitted less than 8 tonnes a person, among them France (4.4 t), Sweden (3.6 t) and the Netherlands (7.1 t); at the peak in 2010, 34 rich countries were above that line. Part of the fall is production that moved abroad: counted by consumption, Britain emitted 7.3 tonnes a person in 2022, still well down from 11.6 tonnes in 1990.
- Which rich countries still emit the most CO₂ per person?
- In 2022, 22 of the 59 rich countries emitted more than 8 tonnes of CO₂ a person. They include the United States (14.8 t), Australia (14.8 t), Canada (14.1 t), Japan, South Korea, Russia, Poland and the Gulf states; Saudi Arabia emitted 19.0 tonnes a person and Qatar 35.8 tonnes.
- When did the United States overtake Britain as the largest emitter, and when did China overtake the United States?
- In 1850 Britain alone produced 62% of the world's CO₂ from fossil fuels. The United States passed Britain in total emissions in 1890 and stayed the world's largest emitter until China overtook it in 2006. Per person the United States was already ahead of Britain by 1910, at 14.2 tonnes against 10.5 tonnes.
- Why did emissions in Russia and Eastern Europe fall in the 1990s?
- Because the economy collapsed, not because it got cleaner. When the Soviet Union was dissolved in December 1991, heavy industry went down with the planned economy. Russia fell from 17.1 tonnes of CO₂ a person in 1990 to 11.0 tonnes in 1995, while income dropped from $12,400 to $8,600 a person; Ukraine fell from 13.6 tonnes to 7.6 tonnes.
- Does the map count the emissions of imported goods?
- No. The map shows territorial emissions: the CO₂ released inside a country's borders from fossil fuels and industry. Emissions made elsewhere to produce imported goods are counted in the country that makes them, and land use and deforestation are not counted at all. Counted by consumption, Britain emitted 7.3 tonnes a person in 2022 instead of 4.6 tonnes, and China 7.3 tonnes instead of 8.2 tonnes.
- Is there an animated map of CO₂ emissions and GDP per country?
- Yes. Moving Polygons has a free animated map of CO₂ emissions against prosperity from 1850 to 2022. Every country is coloured by its income per person and its CO₂ emissions per person at once, in 26 frames, with a bar for the world's yearly emissions and pins for the oil embargo, the end of the Soviet Union, Kyoto, China's entry into the WTO and the Paris Agreement. You can watch it and embed it on your own website.
Text version of the map (timeline, layers and events): Markdown