Animated maps of society and culture
These maps are about what people believe, celebrate, drink, vote for and build, not about who rules them. They follow the spread of Christianity and its branches from about AD 30 to 2025, the switch to the Gregorian calendar, which Catholic Europe made in 1582 and the rest of the continent over the next 340 years, and the gift-bringers that grew out of the cult of Nicholas of Myra, from Sinterklaas to Santa Claus.
Others map a figure or a choice. The countries of Europe take the colour of the drink that leads there (wine, beer or spirits) from 1800 to today, Dutch gemeenten the colour of the party that came first at each Tweede Kamer election since 1937, and the countries of the world are coloured by two figures at once, income and CO₂ emissions per person, from 1850 to 2022. Life expectancy in Europe is drawn at the finest level each country publishes. Two maps show cities growing: Dutch towns from 1300 and the Los Angeles region from 1781, each area in the colour of the period in which it was built.
9 maps
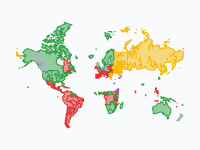
Spread of Christianity, 30–2025
How Christianity spread from a small Jewish movement in Jerusalem across the world, and which branch prevailed where. From c. AD 30 to 2025.
When Europe switched to the Gregorian calendar, 1582–1923
In October 1582 Catholic Europe skipped ten days. The rest of the continent took 340 years to follow: province by province and city by city, with some places switching back to the Julian calendar for a while.
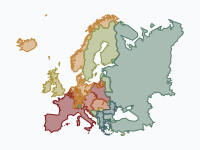
Sinterklaas to Santa: the bearded gift-bringers, 343–2026
Who brings the presents? One 4th-century bishop, Nicholas of Myra, and what Europe and then the world made of him. The pale ochre wash is the saint's cult, spreading from Lycia through Byzantium, to Bari (1087) and…
Read the article: From Sinterklaas to Santa Claus, 343–2026: An Animated Map of the Gift-Bringers
Wine, beer or vodka? Europe's drinking belts, 1800–today
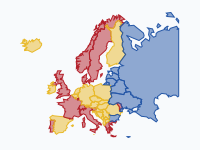
Which drink leads in each country of Europe, from 1800 to today? Red = wine, yellow = beer, blue = spirits (vodka, genever, akvavit, schnapps, rakija).
Read the article: Wine, Beer or Vodka? How Europe's Drinking Belts Blurred (1800–2026)
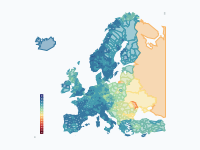
Life expectancy in Europe, 1945–2024
How long can a newborn expect to live? Life expectancy at birth (both sexes) across Europe from 1945 to 2024, one frame per year, at the finest level each country publishes: countries first, then regions and provinces…
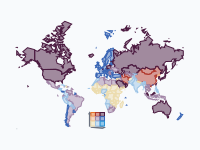
Carbon vs Prosperity: CO2 Emissions and Wealth by Country, 1850–2022
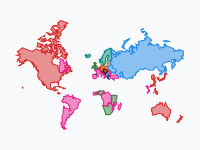
How much carbon does prosperity cost? Each country is coloured by two figures at once: its income per person (the bluer, the richer) and its CO₂ emissions per person (the more orange and red, the more it emits).
Read the article: Carbon vs Prosperity, 1850–2022: An Animated Map of CO₂ Emissions and Wealth
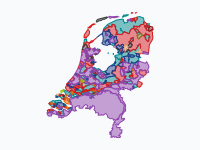
Who came first where: Tweede Kamer elections by gemeente, 1937–2025
Which party got the most votes in each gemeente, at every Tweede Kamer election from 1937 to 2025. Each colour is a party; a patch is every gemeente where that party came first, drawn on the gemeente borders of that…
Read the article: Who Came First Where: Dutch Elections by Municipality, 1937–2025
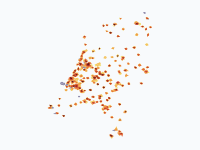
Dutch cities grow, 1300–2025
How the towns and cities of the Netherlands spread across the land, from the walled towns of 1300 to the sprawling urban regions of today.
Read the article: How Dutch Cities Grew, 1300–2025: Seven Centuries on One Map
Los Angeles: How the Sprawl Grew, 1781–2020
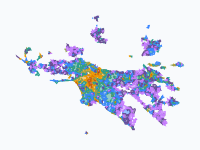
How the Los Angeles region grew from a Spanish pueblo of 44 settlers (1781) into a metro of 18.6 million. Each colour is a growth wave; areas take the colour of the period in which they first became built-up.
Read the article: How Los Angeles Sprawled, 1781–2020: An Animated Map
Make your own animated map
Pick a region and two years, and watch the borders of that time move. You need no account to try it.
Create a map