Twenty-Seven Years Between Oslo and Tirana
A child born in Norway in 1950 could expect to live 71.6 years. A child born in Albania that year could expect 44.5. Those two figures, from the United Nations' reconstruction of every country's population since 1950, put 27 years between Norway and Albania (only Kosovo, at 43.5, was lower), and the gap between them is the starting point of this map. By 2024 Switzerland and Liechtenstein led with 84.2 years and Moldova was lowest with 72.0: still a gap of twelve years, but every country on the map had passed the figure that Norway held in 1950.
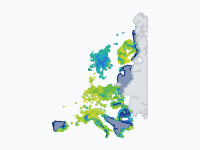
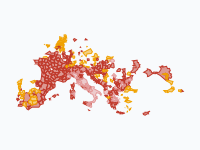
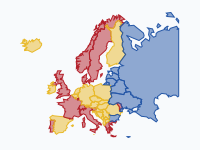
The map shows life expectancy at birth, for men and women together, for every year from 1945 to 2024. It starts with countries and switches to regions as soon as a country's statistics office or Eurostat publishes regional figures: Swedish counties from 1966–1970, Italian regions from 1974, Spanish provinces from 1975, French départements and most of the European Union's NUTS regions from 1990. Seven countries go further, down to their municipalities and districts: Norwegian kommuner from 1990–1996, German districts from 1993–1995, Dutch municipalities from 1996–1999, Swedish kommuner from 1998–2002, Danish kommuner from 2000–2004, British local authorities from 2001–2003 and Czech districts from 2003–2007, about 2,000 areas in all. An area without a figure stays empty, so the first frames show only the countries whose life tables have been reconstructed for the war years. The colours run from dark red below 50 years to navy above 86, in bands of two years from 68 upwards, on one scale for all eighty years.
Out of the War (1945–1960)
The first frame is a patchwork. In 1945 only the countries with long-running population registers have a figure: the Nordic countries, the Netherlands, Belgium, Luxembourg, France, Switzerland, Italy, Spain, Portugal and the United Kingdom, plus a few reconstructed series further east. The Netherlands stands out. In the Hunger Winter of 1944–45, when the German occupiers blocked food supplies to the west of the country, Dutch life expectancy fell from 61.3 years in 1944 to 55.6 in 1945, and in 1946 it was back at 67.5, one of the highest in Europe. In the Soviet Union the famine of 1946–47 shows up in the reconstructed series as a second dip after the war: 40.4 years in Russia and 45.1 in Ukraine in 1947.
From 1950, when the UN estimates begin, every country is coloured, and the map has a clear north-west to south-east slope. Norway (71.6), the Netherlands (71.4), Sweden (71.1), Iceland (71.0) and Denmark (70.3) lead. At the bottom are Kosovo (43.5), Albania (44.5), Türkiye and Bosnia and Herzegovina (both 47.3) and North Macedonia (50.6), where infant deaths and infectious disease still took a large share of every generation. The following decade was the fastest catch-up on the map. Between 1950 and 1960 Russia gained almost thirteen years (55.5 to 68.3), Albania twelve, Poland almost nine, and Bulgaria and Spain more than seven. By 1960 Iceland led with 74.0, and the bottom of the scale had moved up to Kosovo's 48.7 and Türkiye's 50.8.
The Long Stall in the East (1960–1990)
Then the two halves of Europe parted ways. In Russia, life expectancy was 68.3 years in 1960 and 69.3 in 1990; in Hungary 68.1 and 69.4; in Bulgaria 69.2 and 71.3; in Poland 67.1 and 70.6. Three decades of almost nothing, while the south of Europe gained seven to ten years: Spain went from 69.2 to 77.0, Italy from 69.2 to 77.0 and Portugal from 64.2 to 74.3, and Greece, which started higher, from 70.5 to 77.3. On the map the communist countries stay orange and yellow while the Mediterranean turns green. Demographers put most of the eastern stall down to middle-aged men, who died of heart disease, alcohol and accidents at rates the west had left behind.
Two of the early leaders slowed down too. Denmark gained only 2.7 years between 1960 and 1990 (72.2 to 74.9) and fell from fifth place among the 43 countries on the map in 1950 to nineteenth; the usual suspects there are smoking and drinking among the generations born between the wars. The Netherlands gained 3.7 years (73.3 to 77.0) and fell from second place to sixth. The first regional figures come in during this period. Swedish counties appear from 1966–1970, Norwegian counties from 1971–1975, Italian regions from 1974 and Spanish provinces from 1975. When Eurostat's regional series begin in 1990, the highest regional figures are in rural Castile, in the thinly populated provinces of Soria (80.0), Guadalajara, Teruel and Cuenca, and the lowest in north-eastern Hungary and north-western Romania, below 69. Norway's municipal series starts that year too, and a few Norwegian kommuner, such as Ulstein and Rollag (81.1 for 1990–1996), are higher still.
Collapse and Recovery (1990–2019)
The end of the Soviet Union shows up as a red flush across the east. Russian life expectancy fell from 70.1 years in 1987 to 63.8 in 1994, the deepest fall of any country on the map after the 1940s outside wartime, as unemployment, cheap alcohol and a broken health system hit working-age men. Ukraine fell from 70.3 in 1990 to 67.5 in 1994, Latvia from 69.5 to 65.2 and Estonia from 69.9 to 66.7. The central European countries that joined the European Union in 2004 took a different path: Czechia gained 3.6 years in the 1990s alone (71.4 to 75.0), and by 2019 it was at 79.2, Estonia at 78.8 and Slovenia at 81.0.
By 2019 Switzerland (83.8), Spain (83.5), Liechtenstein (83.4) and Italy (83.3) had the highest life expectancy, and at regional level Spain had pulled clear: the Madrid region reached 85.1 years, followed by the provinces of Álava, Guadalajara and Segovia. The bottom of the regional scale was Bulgarian: every Bulgarian region except the one around Sofia was below 75.5, and Severozapaden in the north-west, a region of shrinking towns along the Danube, had 73.5. Russia had recovered to 73.1, almost the same as Belarus (74.3) and Ukraine (73.9), and Moldova was lowest of the countries at 70.2.
COVID-19 and an Earthquake (2020–2024)
In 2020 the pandemic shows up first in northern Italy. The province of Bergamo, one of the first places in Europe to be overwhelmed, went from 83.4 years in 2019 to 79.7 in 2020, and Cremona, Lodi and Piacenza fell by 3.3 to 3.7 years too. In Spain, Segovia lost 3.2 years and the Madrid region 2.8. In 2021 Bergamo was back at 83.4, while the worst falls had moved east, where vaccination rates were lower: most Bulgarian regions were about four years below 2019, eastern Slovakia and southern Serbia 3.6. Bulgaria as a whole fell from 75.1 to 71.4 and Russia from 73.1 to 69.8. By 2023 most countries were back at or above their 2019 level.
One region drops off the scale in 2023. The earthquakes of 6 February 2023 in south-eastern Türkiye killed more than 50,000 people, and Eurostat's figure for the region of Hatay, Kahramanmaraş and Osmaniye fell from 79.0 years in 2019 to 55.4 in 2023, a red patch in a sea of green. Türkiye's regional series ends with 2023, so the last frame still shows that year there. In 2024 the highest regional figures are again Spanish: the province of Salamanca had 85.8 years and the Madrid region 85.7, followed by Segovia and the Swiss canton of Ticino (85.2). Among municipalities, Danderyd north of Stockholm had about 86.8 years in 2021–2025, and some very small places show even higher, noisier figures. The lowest region of the European Union is still Severozapaden, at 73.9.
How to Read the Map
Each colour is a band of two years (wider below 68) on one scale for the whole map: dark red under 50 years, red from 50 to 60, orange from 60 to 72, yellow from 72 to 76, green from 76 to 80, blue from 80 to 86 and navy from 86. The key is the column of squares in the Atlantic; hover over a square or an area for its name and band. A colour only changes when a value moves 0.4 years past the edge of a band, so small places whose figures wobble from one period to the next do not flicker. An area stays empty until its first figure, and a gap of up to three years in a series keeps the last value (so Türkiye's regions show their 2019 figures in 2020–2022). Zoom in on Britain, the Low Countries, Germany, Czechia or Scandinavia to see the municipalities and districts.
When a country switches from a national figure to regions, or from regions to municipalities, the map crossfades. The finer map does not show a sudden change, only the differences the coarser average hid. All countries are drawn in today's borders, so Germany, Czechia or Ukraine are shown as present-day territories even before 1990. Russia is shown only as far as 45° east, a little beyond Nizhny Novgorod, so that the map fits the page.
Where the Numbers Come From
Life expectancy at birth is not a forecast. It is the average number of years a newborn would live if the death rates of one year, or of a few years, at every age stayed the same for the rest of their life. That makes it a snapshot of mortality at a moment in time, which is why a pandemic year can knock several years off it and the next year can restore them. Every figure on the map is such a period life expectancy from an official or scientific source:
- Countries before 1950: the Human Mortality Database and the reconstructions of Zijdeman and colleagues (Clio-Infra) and of James Riley, where a country has them, as combined by Our World in Data.
- Countries from 1950: UN World Population Prospects 2024, via Our World in Data, and Eurostat's national figures where that series has a gap (Moldova in 2024).
- Regions of the EU, EFTA and candidate countries: Eurostat table demo_r_mlifexp, NUTS 1 and NUTS 2 regions, yearly, from 1990 in most countries and later in others (Poland 2013, Türkiye 2009, Serbia 2017).
- Sweden: 21 counties (län) from Statistics Sweden (SCB), five-year periods from 1966–1970, and 290 municipalities (kommuner) in rolling five-year periods from 1998–2002.
- Norway: counties (fylker) from Statistics Norway (SSB), five-year periods from 1971–1975, and from 1990–1996 municipalities (kommuner) in rolling seven-year periods from the Norwegian public health statistics (FHI and Helsedirektoratet), with fifteen-year averages for the smallest.
- Italy: regions from 1974 and provinces from 2002, yearly, from Istat's life tables.
- Spain: the provinces from 1975, yearly, from INE's basic demographic indicators (the Canary Islands lie outside the map).
- France: 96 départements from 1990 to 2021, yearly, from Insee's long series; Eurostat regions for 2022–2024.
- Finland: 19 regions (maakunnat) from Statistics Finland, rolling three-year periods from 1990–1992.
- Netherlands: 342 municipalities (gemeenten) from RIVM and CBS, table 50152NED, rolling four-year periods from 1996–1999, in the municipal division of 2024.
- Germany: 401 districts (Kreise and district-free cities) from the BBSR's INKAR 2022, three-year averages from 1993–1995 to 2018–2020; Eurostat's 38 regions for 2021–2024.
- Denmark: 94 of the 98 municipalities (kommuner) from Danmarks Statistik, table HISBK, rolling five-year periods from 2000–2004.
- Czechia: 206 districts of municipalities with extended powers (SO ORP) from the Czech Statistical Office (ČSÚ), rolling five-year periods from 2003–2007.
- United Kingdom: 359 local authorities from the Office for National Statistics, rolling three-year periods from 2001–2003, in the boundaries of 2025.
- Boundaries: Eurostat GISCO, NUTS 2024, LAU 2023 (municipal units) and countries 2024, and ONS Open Geography local authority districts for the UK.
These figures are comparable, but not identical. Periods run from one year (Eurostat, Insee, Istat, INE) to three (ONS, BBSR, Statistics Finland), four (RIVM), five (SCB, SSB, Danmarks Statistik, ČSÚ) or seven years (FHI), and a longer period smooths out a peak such as 2020: a five-year Swedish figure that includes 2020 moves far less than a one-year Italian one. To place every figure on the same yearly grid, each frame shows, for every area, the period that contains that year with its midpoint closest to it. Statistics offices also differ in how they treat the oldest ages and which population they count, and Eurostat recalculates its regional series in the newest NUTS boundaries, so a region's figures from the 1990s are given for today's borders. Some sources publish figures for men and women only: Swedish counties and municipalities, Norwegian counties before the 1990s, the UK, France and Czechia. For those, the both-sexes figure on the map is the average of the two, weighted by the ratio of boys to girls at birth (1.05 to 1), which comes within about a tenth of a year of a full both-sexes life table. Read colours across a border loosely, and differences within a country more strictly.
Some series stop before 2024. The UN estimates for countries outside the European Union end in 2023, and so does Eurostat's series for Türkiye, so these keep their 2023 value in the last frame. The data were retrieved on 13 November 2026 (Kosovo and Eurostat's revised 2024 figure for the Algarve on 15 November), and the map description lists every table used.
Down to the Municipality
Seven countries publish life expectancy for their municipalities or districts, and the map shows them all. Small areas have few deaths, so their figures come as averages over three to seven years and are still uncertain: Rozendaal in the Netherlands, a village of about 1,700 people, swings from 83 to more than 100 years between one four-year period and the next. Read single small places with care and look at groups of neighbours instead. What the local figures show is how much a national average hides.
In the United Kingdom, Glasgow City had the lowest life expectancy in 2001–2003, about 72.7 years, against 81.6 in Hart in Hampshire and in Kensington and Chelsea. In 2022–2024 Blackpool (76.3) and Glasgow (76.5) were lowest and Hart (84.9) and Richmond upon Thames (84.7) highest: a gap within one country wider than the one between Switzerland and Romania. In Germany the median eastern district had 74.8 years in 1993–1995, three years after reunification, against 77.0 in the west. By 2018–2020 the medians were 80.3 and 81.3, three of the four lowest districts were in the west (Pirmasens 78.1, Bremerhaven 78.4, Gelsenkirchen 78.5), and Starnberg south of Munich led with 84.0. The German district series ends there, so Germany shows Eurostat's 38 regions for 2021–2024. In the Netherlands, Kerkrade in South Limburg had the lowest figure in both the first period of the Dutch series (75.3 in 1996–1999) and the last (78.3 in 2021–2024), followed in 2021–2024 by Pekela, Heerlen and Oldambt: the former mining towns of South Limburg and the east of Groningen. In Czechia the lowest figures follow the old coal fields of north Bohemia and Silesia (Bílina 72.6 in 2003–2007; Litvínov and Rumburk 75.3 and Karviná 75.5 in 2020–2024), and the highest are around Brno and Prague, with Kuřim at 81.4.
In the north, Danderyd, a suburb of Stockholm, had the highest life expectancy in Sweden in 1998–2002 (82.5 years) and still did in 2021–2025 (about 86.8), while the lowest Swedish figures are in the inland north and the old mining district of Bergslagen, down to 79.4 in Dorotea. Stockholm County went from one of the lowest Swedish counties in 1966–1970 (73.6) to the highest in 2021–2025 (84.3). In Norway, Lebesby in Finnmark had 70.7 years in 1990–1996, the lowest in the country; in 2019–2025 Vardø, also in Finnmark, was lowest at 79.0 and Hjartdal in Telemark highest at 85.9. Copenhagen had 74.7 years in 2000–2004, the second lowest of the Danish municipalities, and 80.9 in 2021–2025, when the bottom of the Danish map was Lolland (78.6) and the top Gentofte and Lyngby-Taarbæk just north of the capital (84.1). Finland publishes regions only: Åland, the Swedish-speaking islands, is highest (84.0 in 2023–2025) and Kainuu in the east lowest (80.4).
Chronological Timeline
- 1945 — Hunger Winter: Dutch life expectancy falls to 55.6, from 61.3 in 1944
- 1946 — The Netherlands back at 67.5
- 1947 — Soviet famine: 40.4 years in Russia, 45.1 in Ukraine
- 1950 — UN estimates begin; Norway 71.6, Albania 44.5
- 1960 — Iceland leads with 74.0; Russia at 68.3
- 1966–1970 — First regional figures: Swedish counties
- 1971–1975 — Norwegian counties
- 1974 — Italian regions
- 1975 — Spanish provinces
- 1990 — Eurostat regions, French départements, Finnish regions and Norwegian kommuner
- 1994 — Russia at 63.8, down from 70.1 in 1987
- 1993–1995 — German districts; eastern median 74.8, western 77.0
- 1996–1999 — Dutch municipalities
- 1998–2002 — Swedish kommuner
- 2000–2004 — Danish kommuner
- 2001–2003 — UK local authorities; Glasgow City at 72.7
- 2002 — Italian provinces
- 2003–2007 — Czech districts
- 2019 — Madrid region 85.1; Switzerland 83.8
- 2020 — COVID-19: Bergamo falls from 83.4 to 79.7
- 2021 — Bulgaria falls to 71.4, Russia to 69.8
- 6 February 2023 — Kahramanmaraş earthquakes; Hatay region at 55.4
- 2024 — Salamanca 85.8, Switzerland and Liechtenstein 84.2, Moldova 72.0
Watch eighty years of European life expectancy, and zoom in on your own region or municipality to see when its figures begin.
Explore the full interactive map →Frequently asked questions
- Which European country has the highest life expectancy?
- In 2024 Switzerland and Liechtenstein, both at 84.2 years, followed by Spain (84.0), Sweden (83.8) and Italy (83.7). The highest regions are in Spain: the province of Salamanca had 85.8 years and the Madrid region 85.7, with the Swiss canton of Ticino at 85.2. Among municipalities, Danderyd north of Stockholm had about 86.8 years in 2021–2025.
- Where in Europe is life expectancy lowest?
- Among the countries with a figure for 2024, Moldova is lowest at 72.0 years, followed by Bulgaria at 75.8. In 2023 Russia had 73.2 and Ukraine 73.4. The lowest region of the European Union is Severozapaden in north-west Bulgaria, with 73.9 years in 2024, almost twelve years below Salamanca.
- How much has life expectancy in Europe risen since 1950?
- By ten to thirty-five years, depending on the country. Norway went from 71.6 in 1950 to 83.2 in 2024, Spain from 61.8 to 84.0, Portugal from 58.5 to 82.8 and Albania from 44.5 to 80.4. In 1950 the gap between the highest country (Norway) and the lowest (Kosovo, 43.5) was 28 years; in 2024 it was about 12.
- Why did life expectancy fall in Russia in the 1990s?
- After the collapse of the Soviet Union, Russian life expectancy fell from 70.1 years in 1987 to 63.8 in 1994. Demographers put most of the fall down to deaths of working-age men from heart disease, alcohol, accidents and violence, in the economic crisis that followed. In the same years Ukraine lost almost three years, Estonia three and Latvia more than four.
- How did COVID-19 affect life expectancy in Europe?
- In 2020 the largest falls were in northern Italy and central Spain: the provinces of Bergamo and Cremona lost 3.7 years, Lodi 3.6, Piacenza 3.3 and Segovia 3.2. Bergamo was back at its 2019 level in 2021. In 2021 the worst falls moved east: most Bulgarian regions lost about four years against 2019, as did eastern Slovakia and southern Serbia, and Bulgaria as a whole fell from 75.1 to 71.4.
- Where in the UK is life expectancy lowest?
- In 2022–2024 Blackpool had the lowest life expectancy of the UK's local authorities, about 76.3 years for men and women together, followed by Glasgow City (76.5). The highest were Hart in Hampshire (84.9) and Richmond upon Thames (84.7). In 2001–2003 Glasgow City was lowest, at 72.7.
- Is there an animated map of life expectancy in Europe?
- Yes. Moving Polygons has a free animated map of life expectancy at birth in Europe from 1945 to 2024, by country and, once official figures exist, by region, province or département, and by municipality or district in the United Kingdom, the Netherlands, Germany, Denmark, Sweden, Norway and Czechia, on one colour scale for all years.
Text version of the map (timeline, layers and events): Markdown