How Moving Polygons Works
Create animated maps that show how regions, territories, and boundaries transform over time — in four simple steps.
Draw Your Polygons
Open the visual editor and start drawing directly on an interactive map. Click to place points, drag to reshape, and split edges for precision. Create multiple polygon layers, each with its own color — no GIS expertise needed.
- Point-and-click drawing on a Mapbox-powered map
- Drag nodes and edges to reshape polygons
- Multiple independent polygon groups per map
- Choose from satellite, street, or terrain base maps
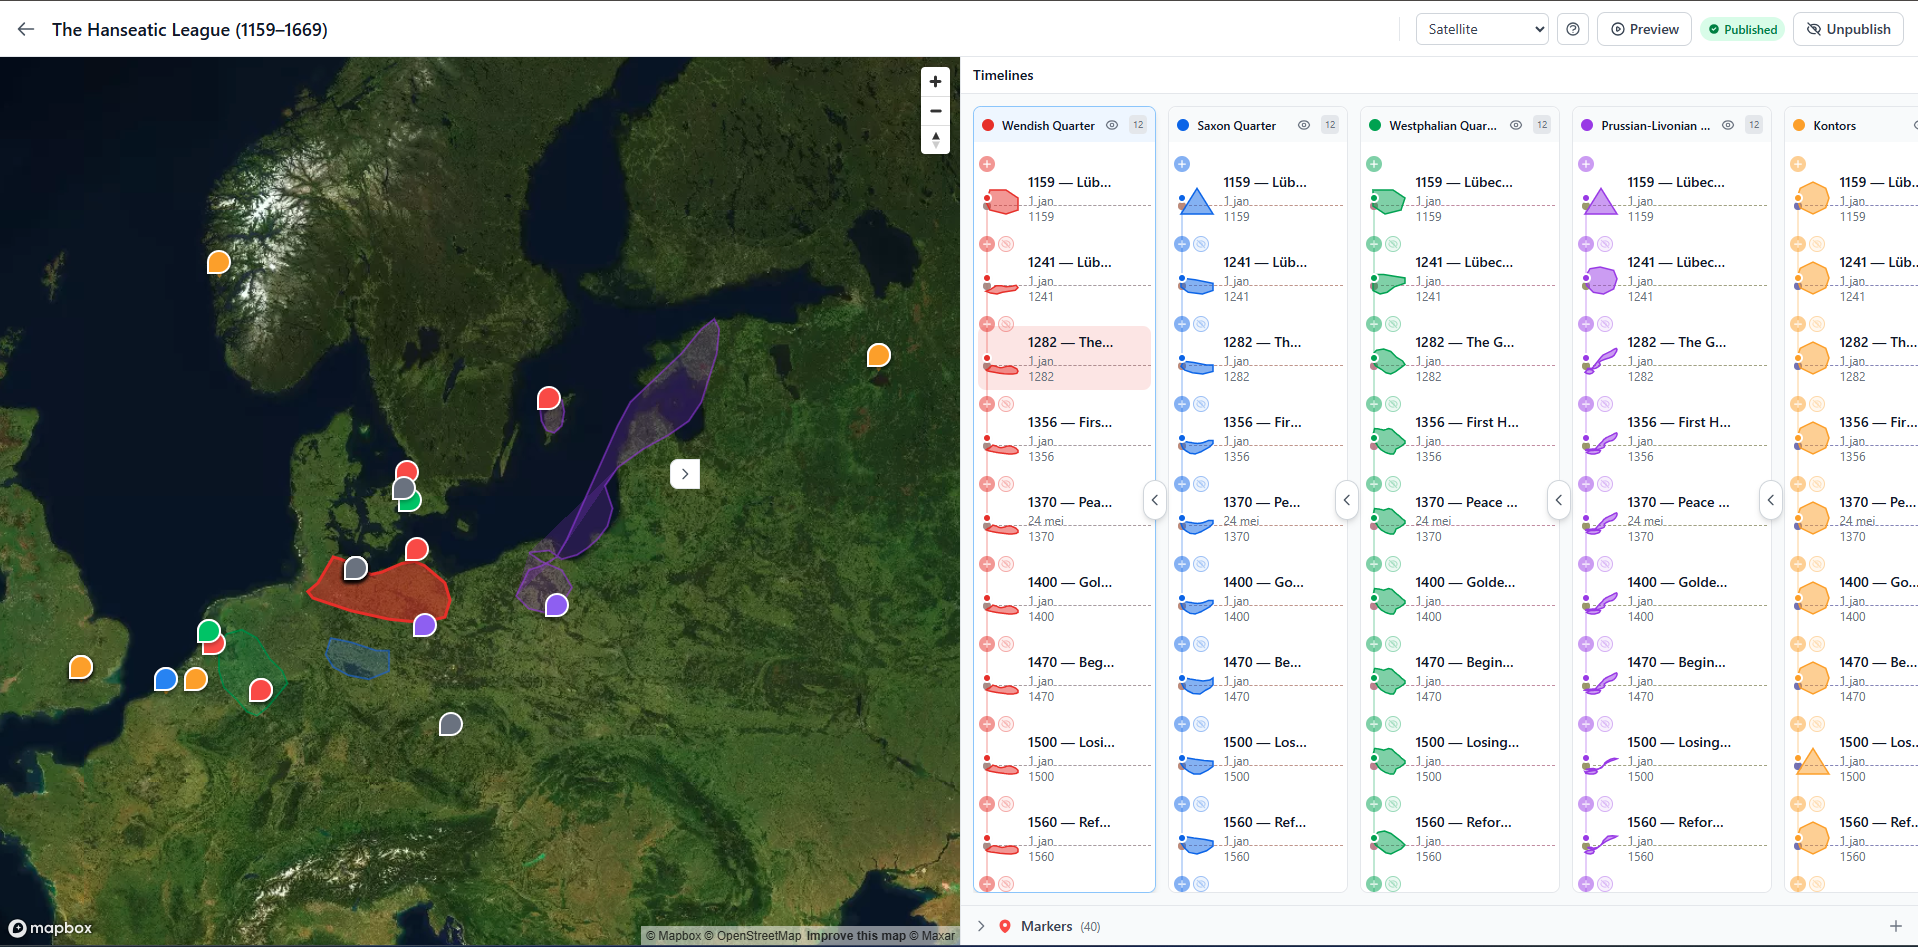
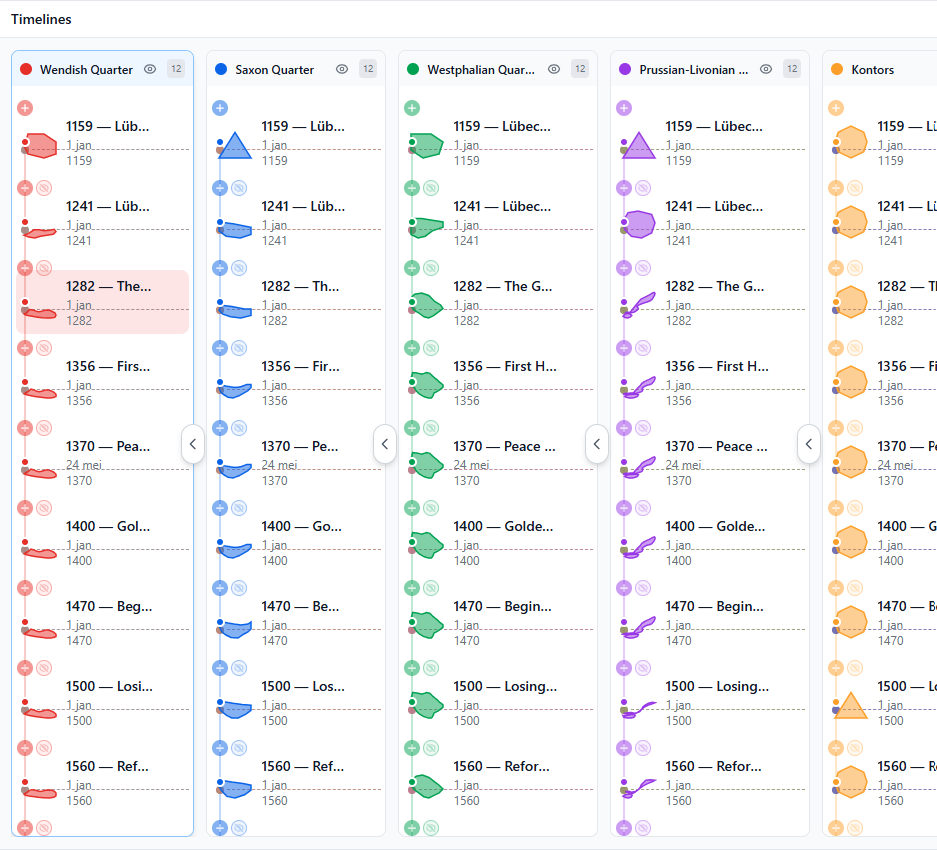
Add Timeline States
Give each polygon state a timestamp — a year, date, or any label like "Phase 1" or "Series A". Add as many states as you need. Moving Polygons automatically generates smooth morphing transitions between them.
- Label states with dates, years, or custom text
- Add unlimited timeline states per polygon
- Automatic smooth interpolation between states
- Reorder and edit states at any time
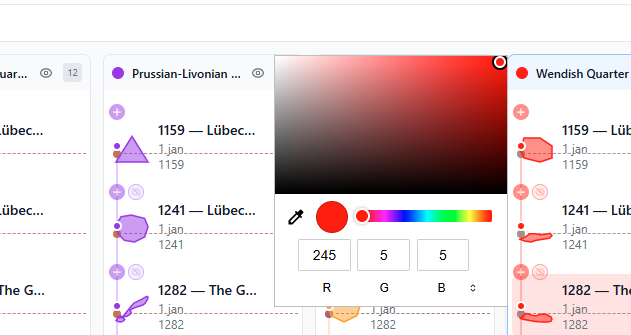
Customize Your Map
Fine-tune the look of your map. Adjust colors, opacity, and stroke styles for each polygon group. Add markers with descriptions to highlight specific locations. Everything updates in real-time as you edit.
- Per-polygon colors, fill opacity, and stroke styles
- Add location markers with titles and descriptions
- Semi-transparent overlays for layered visualizations
- Zoom from continent-level down to street-level
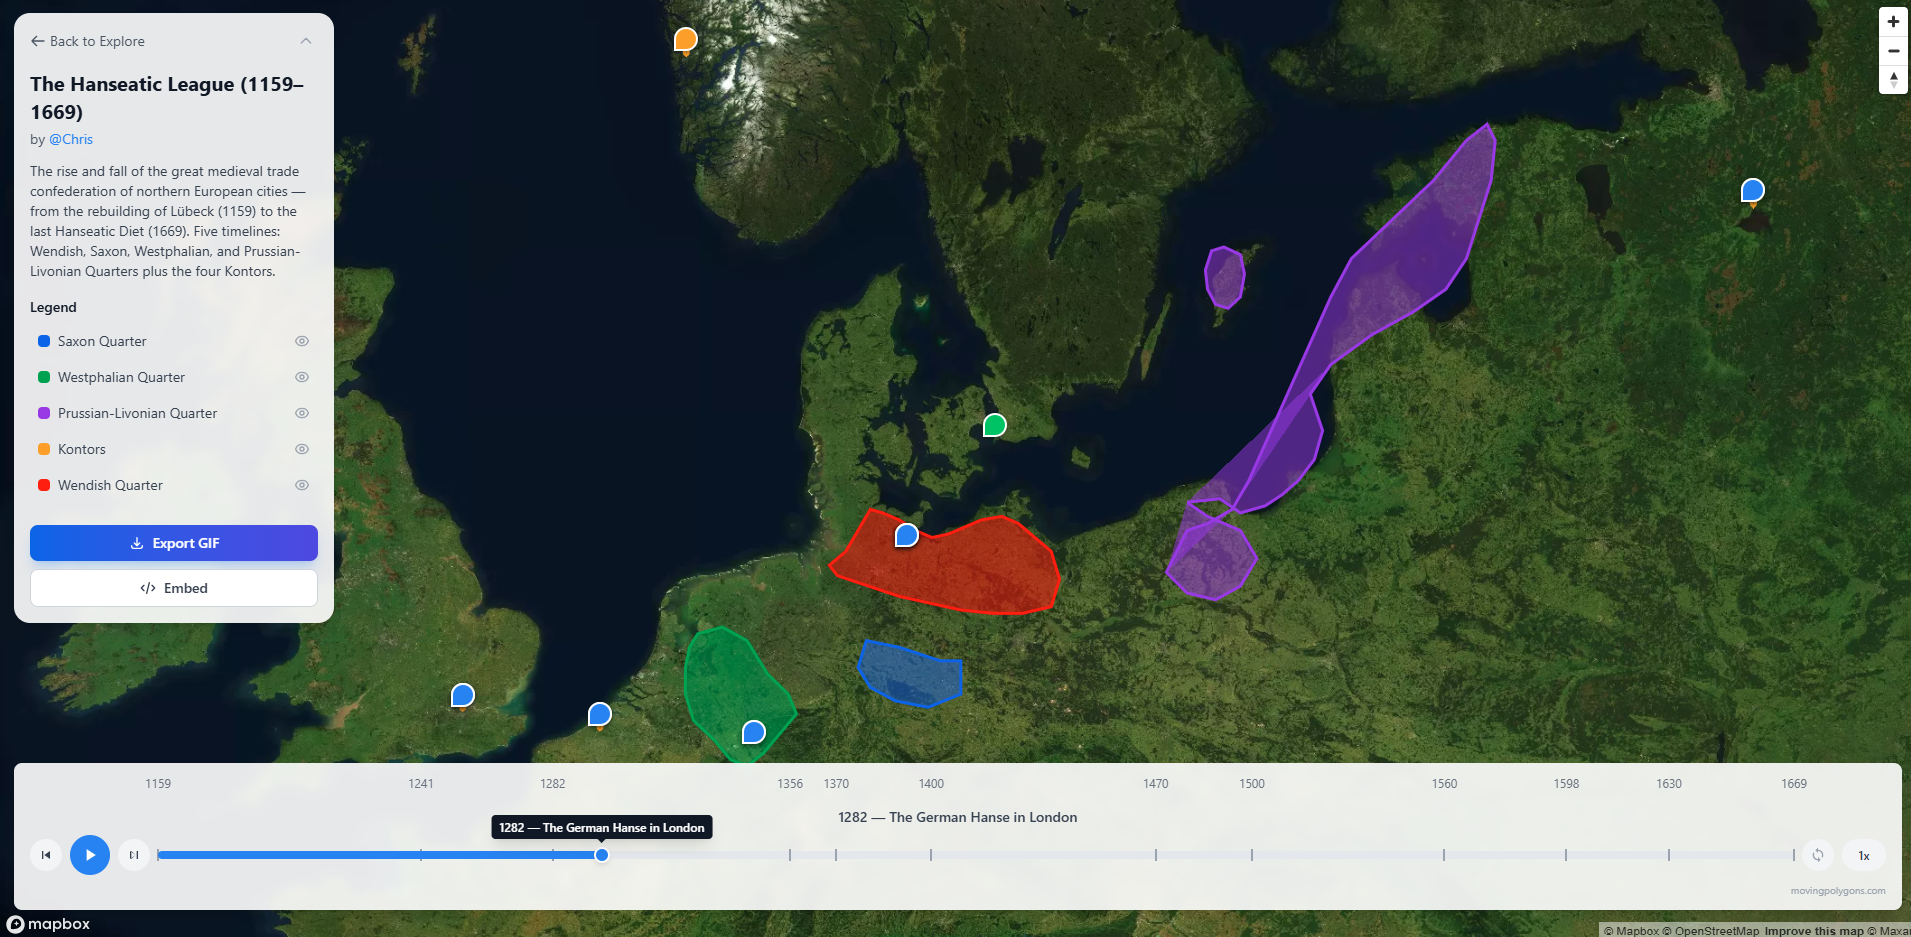
Publish & Share
Hit publish and your map gets a unique, permanent URL. Share it anywhere — social media, presentations, reports. Embed it in any website with a single iframe tag. Social preview images are generated automatically.
- Unique shareable URL for every published map
- Embed via iframe in any website or LMS
- Auto-generated Open Graph images for social sharing
- Playback controls: play, pause, scrub, and loop
Everything You Need
Built for analysts, planners, educators, and anyone who needs to visualize geographic change.
No-Code Editor
A fully visual editor — no programming, no GIS software, no command line. If you can click and drag, you can create animated maps.
Smooth Animations
Polygons morph seamlessly between timeline states. No animation code required — the platform handles all the interpolation automatically.
Embeddable
Drop your map into any website, blog, or learning platform with a single iframe tag. Works in Canvas, Moodle, Google Sites, and more.
Community Library
Browse maps created by others. Copy any published timeline into your own map and customize it — perfect for building on existing work.
GeoJSON Import
Already have geographic data? Import GeoJSON files directly into the editor. Your existing boundaries and shapes become animated timelines.
Export to GIF
Export your animated map as a GIF for presentations, social media, or reports. Available with a Pro subscription.