Explore Maps
Discover animated polygon maps created by our community
All maps
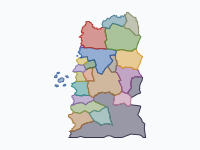
The Northern Wars of the Witcher Saga, 1239–1268
by @chrisjager · 37 polygons
Nilfgaard against the Northern Kingdoms in Andrzej Sapkowski's Witcher novels: Ebbing 1239, the fall of Cintra and the battles of Sodden 1263, the Second War from the Thanedd coup to Brenna and the Peace of Cintra, 1267–68. Moving blocks are armies. Unofficial fan map on an original basemap; not endorsed by Andrzej Sapkowski or CD PROJEKT RED.
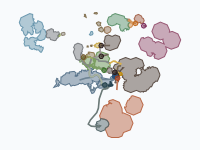
Middle-earth: from The Hobbit to the Grey Havens (TA 2941–3021)
by @chrisjager · 139 polygons
The journeys and wars of The Hobbit and The Lord of the Rings on an ink map of Middle-earth, after Tolkien's books (not the films): Thorin and Company and the Battle of Five Armies (2941), the long years in between, then the Fellowship of the Ring, the War of the Ring in Rohan, Gondor, Mordor and the North, the Scouring of the Shire, and the Ring-bearers sailing West from the Grey Havens (3021). Every company and army slides along its route between the dated stops of Appendix B (The Tale of Years) and the chapters; the realms are a pale wash. Dates are Shire Reckoning as Tolkien prints them; in-between days are reconstructed. Sources: The Hobbit, The Lord of the Rings and its appendices, Unfinished Tales; Tolkien Gateway; the LotR Project timeline. A non-commercial fan map: Middle-earth © The Tolkien Estate; map data ME-GIS (ME-DEM project).
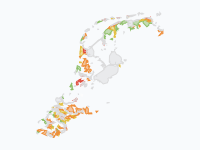
How the Netherlands Rose from the Sea, 500 BC–2026
by @chrisjager · 29 polygons
Grey = water, white = land of the time. Today's land won from the water: green <1250, yellow 1250–1600, orange 1600–1850, red 1850–1950, purple >1950. After Vos's paleogeographic maps (Deltares/RCE); 1953 flood extent after Lencer, Wikimedia Commons, CC BY-SA 2.5.
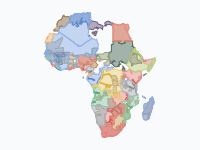
The Scramble for Africa, 1870–1914
by @chrisjager · 55 polygons
Africa's partition and the African states it overran. Dark: land a power actually controlled; light wash: what it claimed by treaty. African states keep their own colours until conquered. Control extents are estimates. Sources: Pakenham; Cambridge History of Africa; Hertslet; Cliopatria (CC BY 4.0); Natural Earth.
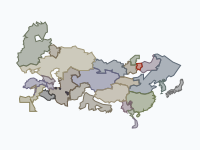
The Mongol Empire, 1206–1368
by @chrisjager · 52 polygons
Temüjin's rise, the largest land empire in history and its split into four khanates: Yuan (brick red), Golden Horde (gold), Chagatai (green), Ilkhanate (blue). Light tints = tributaries; greys and olives = independent neighbours; arrows = campaigns. Sources: Atwood, May, Cambridge History of China 6, Allsen.
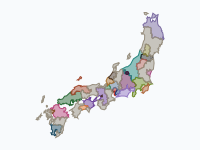
The Sengoku period: the unification of Japan, 1560–1615
by @chrisjager · 70 polygons
Fifty-five years of the Warring States period, from Okehazama (1560) to the fall of Osaka Castle (1615): how Oda Nobunaga, Toyotomi Hideyoshi and Tokugawa Ieyasu forced a realm of rival daimyō into one. Each colour is a clan's domain, province by province and district by district; paler red = Oda allies and generals, pale gold = lords under Toyotomi rule, grey = smaller lords, leagues and temples. In 1600 the map splits into Ieyasu's Eastern army (light blue) and the Western army (wine red). The stitched tokens are the armies of the great campaigns. Sources: M. E. Berry, Hideyoshi; J. Lamers, Japonius Tyrannus; G. Sansom, A History of Japan 1334–1615; Cambridge History of Japan vol. 4; S. Turnbull, The Samurai Sourcebook; Japanese Wikipedia province and castle articles. Dates Julian before October 1582, Gregorian after. Borders: 『旧国・旧郡境界データセット』(CODH) 「幕末明治地勢地図境界データ」(人間文化研究機構)を加工, doi:10.20676/00000454, CC BY-NC 4.0.
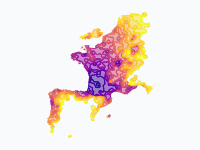
The spread of the Asian hornet across Europe, 2004–2026
by @chrisjager · 23 polygons
Where the yellow-legged (Asian) hornet, Vespa velutina, was first recorded, coloured by year: dark purple 2004 to yellow 2026. Painted within 25 km of repeated records; one-off finds are pins. Data: GBIF.org (Oct 2026), MNHN, GOV.UK, published first records.
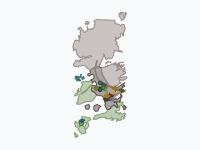
The Dance of the Dragons, 129–131 AC
by @chrisjager · 62 polygons
The Dance of the Dragons, the Targaryen civil war of George R.R. Martin's Fire & Blood: the Greens of King Aegon II (green) against the Blacks of Queen Rhaenyra (charcoal), 129–131 AC. Dragons fly as dragon tokens, armies march as discs, fleets sail as ships; pins mark battles and deaths. Coloured land shows who held it, bare cloth is neutral; teal is the Ironborn, gold the realm reunited under Aegon III. Follows the book, not House of the Dragon. Fire & Blood gives few exact days (Viserys's death, the Gullet, the Gods Eye, Rhaenyra's death, Sunfyre's death); the other dates are reconstructed from its relative cues ('nine days later', 'a nineteen-day march') and travel times, moons read as months. Places missing from the base map are estimated. Sources: Fire & Blood; A Wiki of Ice and Fire. Map data by cadaei, after Tear, theMountainGoat, Werthead and Other-in-Law; world © George R.R. Martin; CC BY-NC-SA 3.0, non-commercial fan map. Not affiliated with or endorsed by HBO or George R.R. Martin.
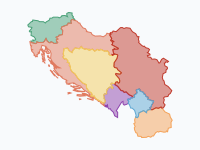
From Serbia to Yugoslavia and back, 1804–today
by @chrisjager · 15 polygons
How the lands of the South Slavs moved from Ottoman and Habsburg rule to an independent Serbia, then to Yugoslavia, and finally to the seven states of today. The map starts with the First Serbian Uprising of 1804, follows Serbia's autonomy (1815–30), independence (1878) and expansion in the Balkan Wars (1912–13), the creation of the Kingdom of Serbs, Croats and Slovenes (1918), the Axis partition of 1941, socialist Yugoslavia (1945–91), and its break-up from 1991. Only the territory of the former Yugoslavia is shown, coloured by who ruled each part. Notes on accuracy: historical borders are reconstructed from modern municipal boundaries, so lines are approximate (to the nearest municipality). The 1804–1813 rebel extents and the 1941 occupation zones are simplified; Dalmatia's Napoleonic period (1805–13) and the 1943 Italian capitulation are not shown. Kosovo is shown separately from 1999: it was placed under UN administration that year and declared independence in 2008, which Serbia does not recognise; its status remains disputed. Sources: modern borders from Natural Earth (1:10m) and geoBoundaries (municipalities); historical changes per the Treaties of Bucharest (1812, 1913), Akkerman (1826), the hatt-i sharifs of 1830 and 1833, the Congress of Berlin (1878), the Treaties of Neuilly, Trianon and Rapallo (1919–20), the Treaty of Rome (1924) and the Paris Peace Treaty (1947).
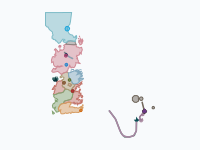
The Wars of Game of Thrones, Seasons 1–8
by @chrisjager · 137 polygons
The wars of HBO's Game of Thrones, seasons 1 to 8, told through the armies on the move: Robb Stark's march south and the Red Wedding, the five kings, the Ironborn in the North, Stannis at the Blackwater and in the snow before Winterfell, Daenerys's road through the Dothraki Sea, Qarth, Astapor, Yunkai and Meereen, the wildlings and the Night's Watch at the Wall, and the long march of the dead. Each commander is a token that slides along a dated route with a trail behind it (circles march, lenses sail, darts fly); fleets keep to the sea. The coloured land is in the background: small pieces around the castles and towns, coloured by the side that held them, with neutral land left as bare cloth. The show gives almost no dates. The in-world dates (298-305 AC) are a reconstruction: each season gets a year-long window, episodes follow in order, and marches are spaced at plausible speeds. Every stop and event in the research notes is marked as documented (on screen), reconstructed, disputed or inferred; places missing from the base map are estimated. Pins mark the turning points; small dots the skirmishes, sieges and arrivals around them. Sources: the episodes, the Game of Thrones Wiki (fandom) and A Wiki of Ice and Fire for geography. Map data by cadaei, after Tear, theMountainGoat, Werthead and Other-in-Law; world © George R.R. Martin; CC BY-NC-SA 3.0, non-commercial fan map. Not affiliated with or endorsed by HBO or George R.R. Martin.
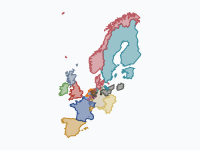
Orange versus the Sun King · The 1672 Disaster Year and the duel of William III & Louis XIV
by @chrisjager · 26 polygons
The Disaster Year (Rampjaar) of 1672 and the forty-year struggle it started between William III of Orange and Louis XIV — from William's birth in 1650 to Louis's death in 1715. The arc follows Luc Panhuysen's 'Oranje tegen de Zonnekoning' (2016): Louis's personal rule and the War of Devolution, the joint French, English, Münster and Cologne attack of 1672, the flooded Water Line and the murder of the De Witts, the coalition wars, the Glorious Revolution that made William king of England, Scotland and Ireland, the Nine Years' War and the Spanish succession. How to read it: dark blue = France as it stood in 1661, mid blue = Louis XIV's lasting conquests, pale blue = towns and lands France took but had to give back (drawn over the occupied country); orange = the Dutch Republic; red-orange = the Stuart kingdoms under William III (1689–1702); greyish blue = territory occupied by France (Lorraine, the principality of Orange). The light blue band in Holland is the inundated Water Line of 1672–74 (white when it froze). The grey disc is the Brandenburg army of the Great Elector on campaign. Large pins pause playback; small dots show detail on hover. Borders are approximate, built from modern provinces with hand-drawn historical cuts; small enclaves are omitted and the Zuiderzee (now Flevoland) is left as water. Dates are New Style; English events also give the Old Style date where it is the familiar one. Sources: L. Panhuysen, Oranje tegen de Zonnekoning (2016); J. Israel, The Dutch Republic (1995); J. Lynn, The Wars of Louis XIV (1999); Natural Earth boundaries.
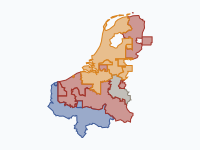
Eighty Years' War in the Low Countries, 1581–1648
by @chrisjager · 10 polygons
The Dutch Revolt against Spanish Habsburg rule, from the Act of Abjuration (Plakkaat van Verlatinghe, 26 July 1581) to the Peace of Münster (1648), shown only for the Low Countries and their immediate borderlands in France and western Germany. The Thirty Years' War in Germany is deliberately left out; German places appear only where the Dutch-Spanish war itself was fought (Lingen, Rheinberg, Wesel, Schenkenschans, Jülich). Background (1566–1581): the Compromise of Nobles and the Iconoclastic Fury (1566) brought the Duke of Alba and his tercios (1567); Egmont and Horne were beheaded (1568) and the war began at Heiligerlee (May 1568). The Sea Beggars took Brielle (1572) and Holland and Zeeland rose for William of Orange; Haarlem fell (1573) but Alkmaar and Leiden held (1573–74). After the Spanish Fury at Antwerp (1576) all provinces joined in the Pacification of Ghent, but Don John's victory at Gembloux (1578) and the Unions of Arras and Utrecht (January 1579) split the Netherlands into a reconciled Walloon south and a rebel north. The map opens with that front line in July 1581. Colours: red = Spanish crown / royalists; orange = rebels, from 1588 the sovereign Republic of the United Provinces; blue = France (Anjou's protectorate at Cambrai 1581–95, conquests as Dutch ally from 1635); grey = the neutral Prince-Bishopric of Liège. Event pins are coloured by the side that prevailed (purple = political event); click a pin for the commanders. Smaller actions are shown as small dots (hover). Borders are approximate. Control is drawn by districts built from modern provincial borders, while in reality armies held fortified towns and the open countryside between them was often contested or paid contributions to both sides — hence the soft vintage borders. Modern coastlines are shown; the 17th-century coast (Zuiderzee, Haarlemmermeer, Zeeland islands) differed. The troop bar compares soldiers under arms (not casualties); many figures are estimates, shown with a lighter range band. Sources: Geoffrey Parker, The Dutch Revolt (1977) and The Army of Flanders and the Spanish Road (2004); Jonathan Israel, The Dutch Republic (1995); Marjolein 't Hart, The Dutch Wars of Independence (2014); Jan Glete, War and the State in Early Modern Europe (2002); Wikipedia, List of battles of the Eighty Years' War and related articles. Boundaries: Natural Earth.
The Dutch Colonial World, 1588–today
by @chrisjager · 34 polygons
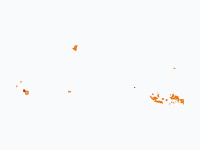
The Dutch overseas world from the Republic of the Seven United Netherlands (1588) to the Kingdom of the Netherlands today. Orange = Dutch-held land (VOC, WIC, state). Lighter orange = the Boer republics founded by Dutch-descended settlers, and Luxembourg in personal union. When land changes hands it briefly takes the new ruler’s colour (red Britain, blue France, green Portugal, teal Koxinga, purple Japan, magenta Indonesia, light blue UN, dark green Suriname, black Belgium) before fading out. Blue pins are voyages of exploration, dark red pins failed expeditions and disasters, small brown dots trading posts. Borders are approximations drawn on modern Natural Earth boundaries; trading forts are shown as small circles. Sources: Natural Earth; general histories of the VOC/WIC (e.g. Gaastra, Den Heijer, Boxer).
Europe's Forests, 1400–2025
by @chrisjager · 8 polygons
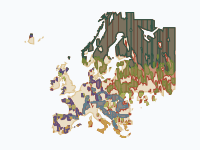
Where Europe's forests stood around 1400, where they were cleared, and what grew back. Colours show forest type; rust shows land that was forest in 1400 and has since been cleared, pale wool shows land whose natural forest was already gone before 1400. This is a reconstruction, not a survey: national forest-cover trajectories (national forest histories; Kaplan, Krumhardt & Zimmermann 2009, 'The prehistoric and preindustrial deforestation of Europe', QSR 28; FAO / Forest Europe statistics for recent decades) are placed on a 0.25° grid by a rule that keeps forest longest in mountains, known forest massifs and land far from historic cities. Forest types are potential natural vegetation; 'planted conifers' marks regrowth and conversion since 1900 in countries where plantations dominate. Treat patterns as indicative, especially before 1800.
Dutch cities grow, 1300–2025
by @chrisjager · 8 polygons
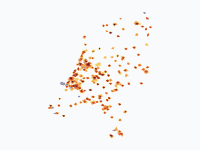
How the towns and cities of the Netherlands spread across the land, from the walled towns of 1300 to the sprawling urban regions of today. Colours show when each part of a town was built: dark red for the medieval core, through orange to pale yellow for the districts of the last 30 years. Grey-violet marks ports, heavy industry and Schiphol. For five centuries growth was slow and stayed inside town walls. Holland's towns boomed after the fall of Antwerp in 1585 and in the Golden Age, then barely grew for almost 200 years. Only after the Fortress Act of 1874, the railways and industrialisation did cities break out of their ramparts. The real explosion came after 1945: in 80 years the built-up area of the country grew several times over, first as garden cities around the big cities, then as planned growth towns (Zoetermeer, Nieuwegein, Almere, Lelystad) and finally as VINEX districts built right against the existing cities. Method: about 60 cities are drawn district by district, with each named district appearing in the years it was built. About 110 smaller towns are drawn schematically: an old core plus growth rings sized from their population and the typical age of Dutch housing. Pre-1850 town areas follow published hectare figures for walled towns, or population divided by the densities measured on Jacob van Deventer's 16th-century town maps. From 1900 on, each city's footprint is sized as population divided by a period-typical urban density (about 24,000 people per km2 in big cities around 1900, falling to about 7,500 today). Shapes are schematic: positions of districts are accurate to a few hundred metres, outlines are not surveyed boundaries. Villages and many small towns are left out. Sources: J. de Vries, European Urbanization 1500-1800 (1984); J.C. Visser, Dichtheid van de bevolking in de laat-middeleeuwse stad (Tijdschrift voor Historische Geografie, 1985); Monumenten Inventarisatie Project city descriptions (Rijksdienst voor het Cultureel Erfgoed); RCE protected townscape reports; T. Stol on Middelburg and R.J. de Vries on Enkhuizen (THG 1983); R. Rutte on Dutch town populations; CBS population statistics; Wikipedia city histories; Natural Earth for land, lakes and rivers.
Where elephants and mammoths lived, 21,000 years ago to today
by @chrisjager · 8 polygons
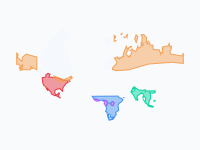
Where elephants and their mammoth cousins lived in the wild, from the peak of the last Ice Age (~21,000 years ago) to today. Colours show species; white shows the ice sheets. During the Ice Age, sea level was ~120 m lower, so some ranges extend over what was then dry land (the Bering land bridge, the North Sea, the Sunda Shelf). Highlights: woolly mammoths shrank from a range spanning Europe, northern Asia and North America to two small islands (St Paul, ~5,600 years ago; Wrangel, ~4,000 years ago). Columbian and pygmy mammoths vanished ~13,000–12,500 years ago. Asian elephants once lived from Syria and the Yellow River to Java; today they hold perhaps 15% of that range. African elephants occupied almost all of Africa south of the Sahara (and the Sahara itself when it was green) until the ivory trade and farming fragmented their range from the 1800s on. Note on the timeline: the map tool cannot store dates before 4713 BC, so the five Ice Age frames (21,000 to 9,000 years ago) are squeezed into 4700–4300 BC on the time slider. Their labels give the real ages. Ranges are hand-drawn approximations at continental scale, not survey data: prehistoric ranges come from dated fossils and climate models; historical ranges from written records; recent ranges are generalised from the African Elephant Database and IUCN maps. Ice-age coastlines are approximated with the 200 m depth contour. Main sources: Stuart et al. 2004 (Nature) and Stuart 2005; Nogués-Bravo et al. 2008 (PLoS Biology); Nadachowski et al. 2018 (Quaternary Research); Graham et al. 2016 (PNAS, St Paul Island); Vartanyan et al. (Wrangel Island); Dyke 2004 and Hughes et al. 2016 (ice sheets); Elvin 2004, The Retreat of the Elephants, and Wen Huanran (China); Çakırlar & Ikram 2016 (Syrian elephants); Sukumar 2003, The Living Elephants; de Silva et al. 2023 (Scientific Reports, Asian elephant habitat since 1700); Thouless et al. 2016, African Elephant Status Report (IUCN); Douglas-Hamilton 1987 (1979–1987 African elephant numbers).
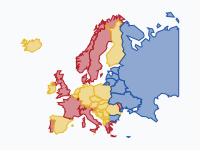
Wijn, bier of wodka? Europa 1800–heden
by @chrisjager · 43 polygons
Welke drank domineert per land, 1800 tot heden? Rood = wijn, geel = bier, blauw = sterkedrank (wodka, jenever, akvavit/brandewijn, rakija). Kleur = de drank met het grootste aandeel in de geconsumeerde pure alcohol. Methode: huidige landsgrenzen voor de leesbaarheid; Turkije en de Kaukasus zijn weggelaten, Rusland tot de Oeral. Overgangsjaren zijn afgerond op het dichtstbijzijnde keyframe. Bronnen: Holmes & Anderson / Univ. of Adelaide Wine Economics (aandelen wijn/bier/sterkedrank 1888–92, 1925–29, 1961–64, 1980–84, 2010–14); WHO Global Information System on Alcohol and Health (2016/2019); Nordic Welfare Centre / CAN (Zweden 1861–2023: brandewijn tot 1989, bier tot 2002, daarna wijn); PARPA (Polen: bier passeert wodka in 1999). Let op: vóór ±1890 en voor Oost-Europa en de Balkan vóór 1960 zijn er nauwelijks betrouwbare cijfers; die kleuren zijn onderbouwde schattingen. Regionale verschillen (Moezel- en Paltswijn, Noord-Franse bierstreek, Pruisische brandewijn) vallen weg in landsgemiddelden. In Rusland haalt bier sterkedrank volgens recente verkoopcijfers in, maar volgens de WHO-cijfers is sterkedrank nog koploper.
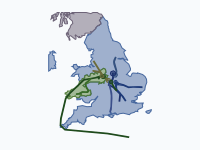
The Wars of the Roses, 1455–1487
by @chrisjager · 141 polygons
Thirty years of civil war between the houses of Lancaster and York, told through the moving armies. Every march, landing, flight and battle from the First Battle of St Albans (1455) to Stoke Field (1487) is followed day by day where the chronicles allow it: 1470, 1471 and 1485 have near-daily itineraries, and in 1471 even the hours are known. Each army is a stitched token that slides along its route, with the road it took behind it; hover a token to see whose army it is. Between dated stops the roads are reconstructed along Roman roads and the Great North Road. The coloured counties are a reconstruction of whose affinity dominated in each phase: loyalty followed lords and the person of the king, not borders. Castles that held out (Harlech, Alnwick, Bamburgh, Dunstanburgh, St Michael's Mount) are small patches of their own colour. Dates are Julian, as in the sources; disputed battle sites and dates are noted in the markers. Sources: the Arrivall of Edward IV, Warkworth, Gregory's Chronicle, Vergil, the Chronicle of the Rebellion in Lincolnshire, the Herald's Memoir, the Paston letters and CSP Milan; Scofield, Life and Reign of Edward IV; Ashdown-Hill's itinerary of Edward IV; the Tewkesbury Battlefield Society daily series; Battlefields Trust; Historic England registered battlefields; historyofwar.org; Wikipedia. County borders: Historic County Borders Project (https://www.county-borders.co.uk).
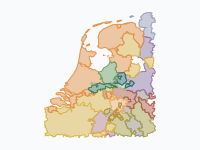
Gelre and Gelderland, AD 100–2026
by @chrisjager · 51 polygons
How Gelderland took shape. The story starts on the Roman Rhine frontier, with the Franks, Frisians and Saxons and the Frankish gouwen. A small county named after Geldern on the Niers grew north across the Rhine: Zutphen (c. 1138), the Veluwe (1182) and Nijmegen (1247–48) made the Duchy of Guelders and its four quarters. Charles of Egmond held out against Burgundy and Habsburg and for a time ruled Groningen, Drenthe, much of Friesland and Utrecht, while his marshal Maarten van Rossum sacked The Hague (1528) and marched on Antwerp and Leuven (1542). In 1543 Guelders passed to Charles V. The Revolt split it: the three lower quarters became a province of the Dutch Republic, Upper Guelders stayed Spanish and was divided in 1713, and Geldern itself is German today. The Disaster Year 1672, the French period, the border treaty with Prussia (1816–17), the battles of 1944–45, Elten (1949–63) and the 1986 border change at Asperen bring it to the present province. Borders are built from the municipalities of 1812 (modern municipalities in Germany and Belgium), so they are accurate to a few kilometres; neighbouring states are drawn coarsely, and early medieval borders are reconstructions. Shades of green are Guelders; a golden tint marks Burgundian or Habsburg rule over the whole duchy. Sources: NLGis municipal borders 1812–1997 (O.W.A. Boonstra, DANS, CC0); © GeoBasis-DE / BKG (VG250); Statbel/geoBoundaries; A. Schoemaker, Gelre en zijn grenzen (historischetopografie.nl); G.H.A. Venner, De overheidsinstellingen van Spaans en Oostenrijks Gelre; Neue Deutsche Biographie (Geldern, Grafen und Herzöge); M. Witteveen, Maarten van Rossem; Wikipedia (nl, de, en) articles on the quarters, ambten, towns, sieges and treaties; preliminary research by @Chris.
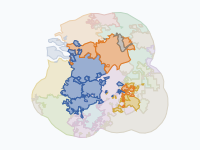
Brabant Through Time: Tribes, Duchy and Provinces (57 BC – 2026)
by @chrisjager · 52 polygons
Brabant has been three different things under one name: a Frankish pagus between the Scheldt and the Dijle, a duchy (1183–1795) that reached from Nivelles to 's-Hertogenbosch, and since 1815 a set of provinces in two countries: Noord-Brabant, Antwerp, Flemish Brabant, Walloon Brabant and Brussels. The map follows its pieces (districts and quarters, later arrondissements) from the Nervii and the counts of Leuven through Burgundy, the Habsburgs, the Dutch Revolt and the split of 1648, the French départements and the Belgian Revolution to the three-way split of 1995. Colours show who ruled each piece: brick red the dukes of Brabant, purple Burgundy, gold Habsburg and Austria, green Spain, orange the Dutch States and the Netherlands, blue France, crimson the United Belgian States and Belgium. Neighbours are pale. Borders before about 1100 are indicative reconstructions from dioceses and rivers. Borders from 1183 to 1795 are built from the parishes of the Historical Atlas of the Low Countries (situation 1500); later borders from Belgian NIS municipality codes and Dutch municipalities. Small or short-lived changes are simplified. Sources: Historical Atlas of the Low Countries and the Duchy of Brabant GIS collection (R. Stapel, IISG, CC BY-SA 4.0); hertogdombrabant.nl (Damen et al., 2021); nl/fr/en Wikipedia on the pagus and landgraviate of Brabant, the duchy, the Generality Lands, the Lands of Overmaas, the départements and the provinces; gemeentegeschiedenis.nl; Statbel; Natural Earth.
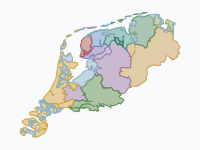
Friesland Through the Ages (12 BC – 2019)
by @chrisjager · 29 polygons
Two thousand years of Friesland and the Frisian coast: the Roman-era Frisii, the Frisian kingdom of Radbod and its defeat by the Franks, Viking rule, the 'Frisian Freedom' without a lord, the Saxon takeover of 1498, the Guelders wars of Grutte Pier and Charles of Egmond (1514–1524), the Habsburg lordship, the Republic, the French years and the modern province. The blue-grey wash shows sea and lakes of the time where there is land today: the Middelzee, the growing Zuiderzee, the Lauwerszee. Borders before 1500 are approximate (tribal areas, Frisia Magna, the three Frisian lands); the Guelders–Habsburg front of 1515–1523 is a reconstruction by grietenij and town from the chronicles; later borders follow the 30 grietenijen and 11 cities. Sources: paleogeographic maps of Vos et al. (RCE/Deltares, CC BY 4.0); HALC 1500 parish atlas; NLGIS municipal boundaries (Boonstra, CC0); BKG VG250; Wikipedia (Frisian Kingdom, Radbod, Lex Frisionum, Rorik, Battle of Warns, Pier Gerlofs Donia, Wijerd Jelckama, Gelderse Oorlogen, Lordship of Frisia, Frise department); Worp van Thabor via toenentoen.nl; De Langen & Mol, De Vrije Fries 100 (2020).
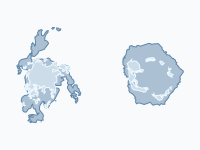
Sea ice at its extremes, 1979–2026
by @chrisjager · 4 polygons
Every winter the seas around the poles freeze, and every summer they thaw again. This map shows both ice caps at their extremes in every year of the satellite record, 1979–2026, as two polar discs side by side: the Arctic on the left, the Antarctic on the right. Each frame is one year: for each pole the winter maximum (blue) and, inside it, the summer minimum (white), each on its own date. The blue band between them is the ice that comes and goes with the seasons. The Arctic summer ice has shrunk the most: its September minimum averaged 7.0 million km² in 1979–1988 and 4.5 million km² in 2017–2026, with the record low of 3.39 million km² in 2012. The winter maximum fell less, from 16.2 to 14.7 million km². The Antarctic held steady for decades and reached its largest maximum, 20.16 million km², in 2014; since then it has dropped sharply, to a record low minimum of 1.85 million km² in 2023 and a record low maximum of 17.07 million km² in 2023. Pins mark each new record from 1985 on (the records that still stand as large pins); the bar at the top compares the two September extremes, the Arctic minimum and the Antarctic maximum. Both shades show sea ice extent: every 25 km grid cell where satellites measure at least 15% ice cover. Maxima and minima are dated on NSIDC's 5-day mean. Until August 1987 the satellites measured every other day, and NSIDC counts the small area around the North Pole that older satellites could not see as ice. The ice edge is smoothed and simplified to about 10 km, floes smaller than about 1,500 km² are left out, and the ice runs under the land, so the coast comes from the basemap. Each disc is a polar stereographic map, the projection NSIDC uses, reaching 40°N and 50°S. Values for 2026 are near-real-time and may still be revised slightly. Sources: NSIDC Sea Ice Index, Version 4 (G02135), daily extent maps and daily extent series, National Snow and Ice Data Center; Natural Earth (land, Antarctic ice shelves).
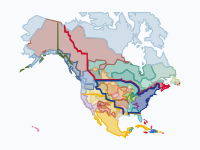
The Making of the United States, 1492–2025: Native Nations and Colonial Powers
by @chrisjager · 98 polygons
Five centuries of North America in one animation: from a continent held wall to wall by Native nations, through the Spanish, French, English, Dutch, Swedish and Russian footholds, to the United States, Canada and Mexico of today. The colours show who really held the ground: a Native nation until its land was settled, conquered or signed away by treaty; a colonial power only around its towns, forts and missions and on land it had taken. The ribbons are the borders the powers claimed on paper: New Spain, New France and Louisiana, New Netherland, New Sweden, the British colonies and Rupert's Land, Russian America, and the United States from 1776. Watch the Dutch on the Hudson (1624–1664, and once more in 1673–74), the fall of Huronia, the Pueblo Revolt, the Proclamation Line, the treaty cessions rolling west from 1784, the removals to Indian Territory, and the reservations that remain. How to read it. Inside the United States, Native land follows the 718 cessions that Charles Royce mapped in 1899, each with the legal date of its treaty or act; land therefore often stays Native on the map after settlers had in fact overrun it, and the Comanche plains are dated to their real loss in 1875. Before the treaties, a nation's country is the land nearest to its known villages: an approximation, since borders between nations were zones, not lines, and many smaller peoples are grouped with their neighbours. Colonial areas are circles around settlements that widen with age. Today's reservations (United States) and reserves (Canada) of about 150 km² and more are drawn, together with the lands that modern treaties gave back into Inuit, Dene and Cree ownership: Inuvialuit (1984), Nunavut (1993), Gwich'in, Sahtu, Tłı̨chǫ, the Yukon First Nations and the James Bay Cree, each from the year of its agreement. Thousands of smaller reserves are too small to show at this scale. Alaska counts as Native land until the Claims Settlement Act of 1971, Hawaiʻi as a Native kingdom until 1893. Canada, Mexico and the Caribbean are drawn more coarsely (Canada by treaty area, Mexico by state). The first Europeans in North America were the Norse, around the year 1000 in Newfoundland; the animation starts with Columbus's landfall. Dates and places come from standard reference works; the towns and forts were re-checked against their articles, the smallest posts and the Native village points were not. Sources: C. C. Royce, Indian Land Cessions in the United States (1899; digital edition by the US Forest Service); US Census Bureau, American Indian areas (2023); Natural Resources Canada, Aboriginal Lands of Canada Legislative Boundaries; Natural Earth; Wikipedia articles on the settlements, treaties and nations.
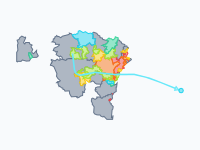
Ebola (Bundibugyo) in DR Congo, 2026
by @chrisjager · 10 polygons
How the 2026 Bundibugyo Ebola outbreak spread through the health zones of eastern and northern DR Congo: from three zones in Ituri in mid-May to 65 zones in seven provinces by mid-October, with exported cases in Uganda and Kenya. Each health zone (zone de santé, the unit DRC's health system reports by) is coloured by the month of its first confirmed case: red May, orange June, yellow July, green August, teal September, cyan October. Grey: the zones of an affected province that have no confirmed case (yet). Circles mark Uganda's 20 confirmed cases in Kampala (May–June; declared over on 28 July) and Kenya's single imported case in Nairobi (October); the line traces that traveller's route from Buta via Kisangani, Beni and Kampala. The bar counts confirmed deaths in DRC. Simplifications: confirmed cases only, no probable or suspected cases. A zone is coloured from the first date a source lists it as affected, and appears at the next keyframe; keyframes follow the weekly WHO situation reports, so dates are rounded to the sitrep week. Zone boundaries are OpenStreetMap's (2021). The newest zone, Dakwa (first case 8 October), is not in that boundary data and is drawn as Ango zone, which WHO shades on its map. Cases evacuated to Germany, France and the Netherlands appear only in the event notes. Sources: WHO AFRO weekly external situation reports 1–22 and WHO Disease Outbreak News; DRC Ministry of Health / INSP daily situation reports 1–151; ECDC; UKHSA "Outbreaks under monitoring"; Wikipedia. Health zones: OpenStreetMap RDC zones de santé via HDX (© OpenStreetMap contributors, ODbL), provinces from GRID3 COD Health Zones v9.0 (CC BY).