Every spring Swedish public television points about thirty cameras at a stretch of the Ångerman river and waits for moose. The programme is called Den stora älgvandringen, The Great Moose Migration. In most years it runs day and night for about three weeks from the middle or end of April, nobody comments on anything, and the whole plot is that moose walk down to the water at Kullberg, near Junsele, hesitate, and swim across on the way to their summer ranges. Nearly a million people watched the first broadcast in 2019. By 2024, the year a record 87 moose crossed in front of the cameras, it was nine million on SVT's streaming service.
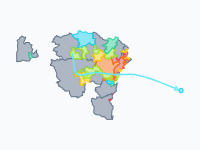
The cameras show one river crossing. The map below shows the rest: a whole year of movement for Sweden's five deer species, from the reindeer herds of the Sámi, which travel furthest, to the fallow deer, which go nowhere. One thing to know before you press play: the dots are a model. No tracked animal is on the map; it is built from published ranges, distances, directions and dates, and the last two sections say how far to trust it.
The Moose That Cross at Kullberg
Sweden had about 300,000 moose at the start of the hunt in autumn 2024, by the yearly estimate of the Swedish University of Agricultural Sciences (SLU). (British readers know the animal as the elk.) Moose are partial migrants: some keep separate summer and winter ranges and others never leave home. SLU has fitted more than 950 of them with GPS collars since 2003, and in 2026 that work went into the moose fact sheets of the UN's Global Initiative on Ungulate Migration. In the north most moose move. They spend the summer up the river valleys, towards the mountains, and the winter lower down; in the mountain region the spring move, in late April and May, covers about 65 to 70 km on average and up to 210 km. The way back starts when the snow gets deep, from late November into January. Further south fewer animals move and the distances shrink, to about 13 km in central Sweden and under 10 km in the south.
Kullberg is where one of those routes meets a big river. SVT, which calls the paths thousands of years old, saw between 21 moose (2023) and 87 (2024) swim across during its broadcasts of 2019 to 2026. The 33 moose that SLU followed with collars around Junsele between 2019 and February 2026 travelled 55 km on average, as the crow flies, between winter and summer range. On the map the migrating moose are light orange, in six regional groups that each move together. The pin at Kullberg appears on 21 April, and by late May the herds nearest the mountains have climbed to their summer range, where the calves are born in May and June.
Reindeer: Eight Seasons Between Mountain and Forest
The longest journeys on the map are made by animals with owners. Sweden's reindeer, about 227,000 in the winter herd of 2023 by the Sámi Parliament's statistics, are all herded, by the members of 51 samebyar (reindeer herding communities: 33 mountain, 10 forest and 8 concession samebyar). The herding year has eight seasons, and a sameby has land for each of them. In high summer the mountain herds are high in the mountains, where the calves get their owner's earmark in July (the pin at Stáloluokta, a summer camp on Lake Virihaure, marks one such place). In late August they drift down to the autumn lands, in early October they rut in the mountain birch, and in the weeks after that they are rounded up and separated.
Then comes the long trek. In November and December the mountain herds move 70 to 275 km south-east to the forest lands towards the coast, part of the way often by lorry today. There, around places like Älvsbyn (another pin), the reindeer dig through the snow for ground lichen until March. In spring-winter they turn west again, the calves are born in May in the foothills and low mountains (the pin at Ammarnäs), and by midsummer the herds are back where the map began. All of this is the pale blue, in two layers: one for the mountain samebyar and one for the forest samebyar, whose reindeer stay in the forest belt all year and move far less.
Roe Deer, Red Deer and Fallow Deer
The other three species move less, or not at all. Roe deer live all over the south and the middle of the country (hunters shot an estimated 98,562 in the season 2024/25) and thin out quickly towards the north. In Norrbotten, the northernmost county, the season's bag was 820, with the highest numbers in the coastal districts of Luleå and Piteå; in inland districts such as Kiruna, Gällivare and Jokkmokk it was one or two roe deer per 100,000 hectares, so the map draws none there. In the snowy north the roe deer do migrate: when the snow comes in late October the light green dots move about 30 km down the valleys towards the coast, and in early May they go back. Elsewhere about one roe deer in five shifts a few kilometres between a summer and a winter range, so they are drawn as residents (see the pin at Grimsö, SLU's wildlife research station).
Gotland is a case of its own. The island has no moose, and its roe deer are newcomers: attempts to release them in the 1800s and the 1940s failed, animals released in the 1980s took hold, and in 2024/25 hunters shot an estimated 2,644 of them. They are on the map as residents. (A handful of escaped fallow deer live on the island too; six were shot that season, and they are not drawn.)
Red deer are few by comparison: 9,408 were shot in 2024/25. Skåne holds the native strain, and the map has thirteen scattered populations, from Skåne to Västernorrland. In September and October the stags walk to traditional rutting grounds (the subject of Anders Jarnemo's research), drawn here in lighter red as a shift of 10 to 15 km, and go back when the rut is over. Fallow deer are park animals gone wild, and there are a lot of them: 79,804 were shot in 2024/25, and the bag has grown by about 8 per cent a year for a quarter of a century. They rut from late October to mid-November and otherwise stay where they are, so their purple dots never move.
How to Read the Map
The map is drawn in the swarm style: a near-black basemap on which every herd area is filled with dots that trail a short tail when they move. Colour is species: pale blue for reindeer, orange for moose, green for roe deer, red for red deer, purple for fallow deer. Within a species the lighter shade is the part that migrates ('Moose, migrating', 'Roe deer, migrating' and 'Red deer stags (rut)' in the legend) and the darker shade stays put. The date wheel turns once for the year: 53 weekly frames from 1 July to 30 June, the last the same as the first, so the year loops. The dates are those of a typical year; the 2025 and 2026 on the timeline only give the wheel a calendar to turn through.
Dots show where the animals are; they do not count them. The number of dots differs per layer, so you can compare one valley with the next within a colour, but the map cannot tell you whether there are more moose than roe deer. Three stretches are worth slowing down for: the end of October, when the light green of the northern roe deer slides towards the coast; 25 November to mid-December, when the pale blue pours south-east out of the mountains; and late April and May, when the orange climbs the valleys again.
How the Map Was Made, and What It Cannot Tell You
The map does not use GPS tracks. It is built the other way round, from published summaries of where each species lives and how it moves. Every species is a set of model herds. A herd is a disk with a radius of 11 km, the shape of a layer in a given week is the smoothed outline of all its disks, and the renderer fills that outline with dots, about 30,000 over the whole map. There are 257 reindeer herds of about 900 animals each, 340 moose herds, 296 roe deer herds, 60 red deer groups and 80 fallow deer groups.
For reindeer the seasonal lands and migration routes come from the land-use accounts of the samebyar published by the Sámi Parliament (Samebyarnas markanvändningsredovisning), generalised: each herd stands inside its sameby's land for the season and walks along the mapped routes in between. For moose, the share that migrates, the distance, the direction and the dates are set per region from the fact sheets (mean routes of 13 km in central Sweden, 18 km on the Västerbotten coast, 26 km in the northern inland), Singh et al. (2012) and Ball et al. (2001). All migrating herds of a region leave in the same weeks and in the same direction, which real moose do not do. Roe, red and fallow deer are placed with the harvest statistics of the hunters' association, Svenska Jägareförbundet, with Höglund (2018) for roe deer and Jarnemo for the red deer stags. In November 2026 the roe deer were checked against the association's county reports for 2024/25: Gotland got its roe deer, and ten herds in inland Norrbotten came off the map.
The limits follow from the method. Where a single herd stands inside its range is random, so do not look for the moose of your own valley. The dates are typical ones and say nothing about the winter of 2025–26. Routes are straight lines, except where reindeer follow a mapped migration route. And small numbers are left out: the fallow deer of Gotland, the few roe deer of the far north.
Chronological Timeline
- 1 July — High summer: reindeer high in the mountains
- 15 July — Calf marking in the summer lands
- 2 September — The moose hunt opens in the north
- 16 September — Red deer stags gather for the rut
- 7 October — Reindeer rut in the mountain birch
- 21 October — Round-ups: the reindeer are separated
- 28 October — First snow: roe deer head for the coast
- 4 November — Fallow deer rut in the south
- 25 November — The long trek south-east to the forest lands begins
- 9 December — Moose leave the mountains as the snow deepens
- 24 March — Spring winter: reindeer turn west
- 7 April — Moose in the south move first, only a few km
- 28 April — The Great Moose Migration is under way
- 5 May — Moose swim the Ångermanälven
- 12 May — Reindeer calving season
- 2 June — Moose calves and roe fawns are born
- 30 June — A year later: back where they started
Start the map at 21 April and play on to the end of May: the light orange dots of northern Sweden move up the valleys past the Kullberg pin while the pale blue reindeer herds walk west to their calving lands.
Explore the full interactive map →The animal that hunts them: how the wolf came back to Europe, Sweden included, between 1970 and 2026.
Read about the wolf map →Frequently asked questions
- What is The Great Moose Migration?
- The Great Moose Migration (Den stora älgvandringen) is a slow-TV programme of the Swedish public broadcaster SVT, first shown in 2019. For about three weeks from the middle or end of April about thirty cameras film day and night, without commentary, as moose swim across the Ångerman river at Kullberg, near Junsele, on the way to their summer ranges. Between 21 moose (2023) and 87 (2024) a year crossed during the broadcasts of 2019 to 2026, and nine million people watched on SVT's streaming service in 2024.
- When do moose migrate in Sweden?
- In northern Sweden most moose move up the river valleys towards the mountains in late April and May and come back down when the snow gets deep, from late November into January. In the mountain region the spring move is about 65 to 70 km on average and up to 210 km. Further south fewer moose move and the distances shrink, to about 13 km in central Sweden and under 10 km in the south.
- How many moose and reindeer are there in Sweden?
- About 300,000 moose at the start of the hunt in autumn 2024, by the yearly estimate of the Swedish University of Agricultural Sciences (SLU), and about 227,000 reindeer in the winter herd of 2023, by the Sámi Parliament's statistics. All of Sweden's reindeer are herded, by the members of 51 samebyar.
- How far do reindeer migrate in Sweden?
- The mountain herds trek 70 to 275 km south-east in November and December, from the mountains to the forest lands towards the coast, part of it often by lorry today. In spring-winter they turn west again, and the calves are born in May in the foothills and low mountains. The reindeer of the forest samebyar stay in the forest belt all year and move far less.
- Do roe deer migrate?
- In the snowy north of Sweden they do: when the snow comes in late October they move down the valleys towards the coast, drawn on the map as about 30 km, and they return in early May. Elsewhere about one roe deer in five shifts a few kilometres between a summer and a winter range, and the rest stay where they are.
- Are there moose or deer on Gotland?
- Gotland has no moose. Its roe deer were released in the 1980s, after earlier attempts in the 1800s and the 1940s had failed, and have spread over the island: hunters shot an estimated 2,644 of them in the season 2024/25. A handful of escaped fallow deer live there too; six were shot that season.
- Is there an animated map of the moose and reindeer migration in Sweden?
- Yes. Moving Polygons has a free animated map, Sweden's deer on the move, that shows a typical year week by week for reindeer, moose, roe deer, red deer and fallow deer as moving dots, with pins for Kullberg, the calf marking, the winter lands and the calving lands. It is a model built from published ranges, distances and dates; no GPS tracks were used. You can watch it, embed it on your website or export it as an animated GIF.
Text version of the map (timeline, layers and events): Markdown