Six Centuries of Pumping
In 1408 two councillors from Delfland travelled to Alkmaar to see something new: a mill built by Floris van Alkemade and Jan Grietensz. that 'had thrown out water'. It is the oldest firm record of a polder windmill in Holland. Six centuries later, on 1 October 2026, six pumps in the Afsluitdijk at Den Oever started work with a combined capacity of 275 m³ a second, because the rising sea leaves fewer hours each day in which the IJsselmeer can drain by gravity. In between, the low half of the Netherlands has been kept dry by machines: first by wind, then by steam, then by diesel and electricity.
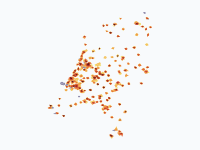
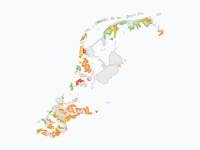
This map follows those machines and the water they fought. Orange fields show where polder windmills stood, darker where there were more of them per 100 km². Every small dot is a pumping station, appearing in the year it was founded and coloured by what drove it: red for steam, purple for diesel and gas, teal for electric, grey where the register does not say. Green areas are lakes pumped dry, in three shades for the windmill, steam and electric eras, and the grey water is the sea and the lakes of the year on screen. Along the way come the floods that broke through anyway, from St Elizabeth's Flood of 1421 to the summer flood in Limburg in 2021, and a bar at the top that counts windmills standing against pumping stations founded.
Wind on the Peat
The trouble started with farming. Peat that is drained to be farmed shrinks and oxidises, so the land behind the dikes kept sinking, and water that once ran off by itself had to be lifted out. A scoop-wheel mill lifted water 1.5 m at most, so deeper polders needed several mills in a row, each passing the water up to the next. The floods of the time show what was at stake: St Elizabeth's Flood of 18–19 November 1421 drowned the Grote Waard between Dordrecht and Geertruidenberg (2,000 to 10,000 dead) and turned it into the Biesbosch, St Felix's Flood of 1530 took the eastern part of Zuid-Beveland, and in 1584 Dutch troops breached the last dike of Saeftinghe to stop the Spanish around Antwerp.
Wind could also do more than keep land dry: it could make new land out of lakes. Amsterdam merchants financed the drainage of the Beemster, which windmills pumped dry between 1609 and 1612; its grid of roads and plots has been a UNESCO World Heritage Site since 1999. The Purmer (1622), the Wijde Wormer (1626), the Bijlmermeer (1627), the Watergraafsmeer (1629), the Heerhugowaard (1631) and the Schermer (1635) followed in Noord-Holland's "Land of Leeghwater". By 1700, 1,196 polder windmills are on record, most of them in Holland and Utrecht. Meanwhile peat diggers cut fuel from below the water table and left new lakes all over Holland, many of which had to be drained again later, and south of Haarlem storms merged four lakes into one Haarlemmermeer that grew from 26 km² in 1531 to about 150 km² by 1647.
Kinderdijk shows how far wind could be pushed. To lift the water of the Alblasserwaard into a reservoir from which it could run out into the river, the Nederwaard built eight brick mills in 1738 and the Overwaard eight wooden ones in 1740. With three neighbours of 1630, 1740 and 1761 they form the group of 19 mills that has been a UNESCO World Heritage Site since 1997. In the 19th century the two water boards added steam pumping stations, and by the 1920s one had been electrified and the other given diesel engines.
Steam Comes Late
Steam was tried surprisingly early. In 1776 Steven Hoogendijk tested a steam engine to pump water out of Rotterdam, and in 1787 a steam pumping station of 43 m³ a minute went into operation on the Blijdorp polder. The first that worked for a polder for years stood at Mijdrecht from 1794, and it was shut down after 1812 because it cost too much. Wind was free, coal was not. The polder of Nootdorp (1844) was the first drained lake emptied by steam alone.
What changed minds was the Haarlemmermeer. Three steam pumping stations, the Leeghwater, the Cruquius and the Lynden, pumped 800 million tonnes of water out of it between 1848 and 1 July 1852 and added 170 km² of land. Along the rivers the floods made the case too: when the Waal dike broke at Leeuwen in February 1861 and 37 people died, the river polders could only drain through their sluices as long as the rivers stood high, and steam stations followed there in the decades after. Of the 398 steam pumping stations on record, 232 were founded in the 1870s and 1880s and 262 were built in Noord- and Zuid-Holland.
Steam changed the scale. In the lakes drained in the windmill era the heritage agency records about one mill for every 120 hectares; the whole Haarlemmermeer was emptied by three steam stations, and the 480 km² Noordoostpolder is kept dry by three diesel and electric ones. The drained lakes add up accordingly: 142 droogmakerijen with about 607 km² up to 1830, 86 with 664 km² in the steam era (1830–1918), and only 17, mostly the IJsselmeer polders, with 1,709 km² since 1918.
The Great Mill Die-Off
Steam did not kill the windmills. In 1900 there were still 3,747 polder windmills standing, many of them the small mills of Friesland, which held out until diesel and electricity arrived. On 7 October 1920 Queen Wilhelmina opened the Ir. D.F. Wouda steam pumping station at Lemmer, which can pump 4,000 m³ a minute out of the Frisian lakes. It is the largest steam pumping station in the world still in operation, fired up in high water about once a year, and a UNESCO World Heritage Site since 1998. In the twelve years after its opening the number of polder windmills on record fell by some 2,200, most of them small Frisian mills.
Nationally the count fell from 3,186 in 1920 to 960 in 1932, the collapse that J. Bazelmans called the molensterven, the dying of the mills, in his 2023 study of it. In May 1923 the society De Hollandsche Molen was founded in Amsterdam to save what steam, diesel and electricity were making redundant. By 1939 more pumping stations had been founded than polder windmills were left. Today 417 complete polder windmills stand, about a tenth of the number around 1880, and on the map the darkest orange, 90 or more mills per 100 km², is gone after 1930.
Do Floods Bring Pumps?
The map puts the floods and the pumping stations side by side, so it invites the question. For 1953 the answer looks like yes: in Zeeland 23 pumping stations were founded in the ten years after the North Sea Flood, in which 1,836 people died in the Netherlands, against 4 in the ten years before; in the rest of the country the number went from 72 to 133. The Zuiderzee flood of 1916, which led to the Zuiderzee Act, and the river flood of 1926, when 39 dikes broke along the Meuse and the Rhine at Lobith carried a record 12,600 m³ a second, left no such mark. Noord-Holland went from 11 to 19 stations after 1916 (rest of the country 55 to 99), and Gelderland, Noord-Brabant and Limburg from 12 to 28 after 1926 (rest 106 to 160). That is an indication, not proof: the numbers are small, the war years lower the count before 1953, and the register is incomplete.
Sluice When You Can, Pump When You Must
After 1953 the Delta Works close the estuaries, from the Veerse Gat (1961) to the Eastern Scheldt barrier (1986) and the Maeslant barrier (1997). The pumps grow with the job. The state pumping station at the sea locks of IJmuiden (1975) lifts the water of the North Sea Canal and the Amsterdam–Rhine Canal into the sea when it cannot run out by gravity; it opened with four pumps, two more in 2004 brought it to 260 m³ a second, and it was long the largest pumping station in Europe; it drains about 2,300 km² directly.
The flood pins after 1953 are of another kind. In 1995 more than 250,000 people and a million animals were evacuated from the river polders; the Waal dike at Ochten began to shift but held, and no dike broke. Together with the Meuse flood of December 1993 it led to Room for the River and the Maaswerken. In 2003 a peat dike at Wilnis failed in a drought, and in July 2021 extreme rain made the Geul burst its banks, damaging 2,300 houses in Valkenburg alone, while the Meuse at Maastricht rose in two days from 50 to about 3,300 m³ a second. The last frame is the new pumping station in the Afsluitdijk, which, with the discharge sluices, gives the dike 45% more discharge capacity. The rule is: sluice when you can, pump when you must.
How to Read the Map
Polder windmills are drawn as density, in three shades of orange for 10+, 30+ and 90+ mills per 100 km². A mill counts from its year of building to the year it disappeared, but many of those years are really the first or last map or survey on which it appears, so the dates pile up at 1832, 1850, 1873–1883 and 1924–1930. Mills therefore appear and vanish in steps at those dates, and the collapse of the 1920s is drawn at the end of the period in which it happened. The cadastre of 1832 adds 2,691 mills that were on no earlier record, nearly nine in ten of them in Friesland, so before 1832 the north is under-recorded, not empty: a lilac wash marks the area where mills are on record only from 1832, and the bar shows the possible range. About 1,000 of the 1832 mills are gone from the record again by 1850.
A pumping station dot keeps the colour of the power it was built for and stays on the map, because the register has no closing dates; many steam stations were later converted or demolished, and hovering over a dot shows its state today. The 1,266 small light-blue dots are wielen, ponds scoured out where a dike once broke. Only eight have a recorded year, so the others appear at the end of 1953, once the last great flood is over. Blue pins are floods and high water, dark pins the machines, green and brown pins the drainages and dikes. Small peat lakes are not drawn as water before they are drained.
How the Map Was Made
The mills come from two registers published by the Cultural Heritage Agency (RCE) in its Landschapsatlas (CC0): the register of vanished mills (molendatabase.org, De Hollandsche Molen) and the register of existing mills. Left out are 867 vanished polder mills without usable dates and 112 surviving stumps; 138 existing mills without a recorded year of building are counted from 1900. Industrial mills and corn mills are not shown. The pumping stations are the 2,228 stations with a founding year in the register of the Nederlandse Gemalenstichting (via RCE), which is strong on historic stations but is not a complete list of today's; 435 without a year are left out. The drained lakes are the RCE droogmakerijen layer after the NAi Polder Atlas, each shown from the first frame at or after its year of drainage (23 early polders dated only 'before 1550' appear in 1570), and the breach ponds are the RCE wielen layer.
For the history the map draws on J. Bazelmans, 'Het molensterven in Nederland' (Tijdschrift voor Historische Geografie, 2023), Geuze and Feddes, Polders! (2005), Flevolands Geheugen on drainage by windmills and engines, Geschiedenis van de techniek in Nederland 1800–1890 (vol. II), Rijkswaterstaat (the floods of 1926 and 1995, IJmuiden and the Afsluitdijk in 2026), KNMI (Rhine and Meuse discharges), Wageningen University & Research (July 2021) and Utrecht University (Wilnis 2003, Veenendaal 1855). The coastline, the big lakes and the 1953 flood come from our map of Dutch land reclamation, after the paleogeographic maps of Vos et al. (Deltares/RCE), and are schematic.
Chronological Timeline
- 1408 — Oldest firm record of a polder windmill, at Alkmaar
- 18–19 November 1421 — St Elizabeth's Flood; the Grote Waard becomes the Biesbosch
- 5 November 1530 — St Felix's Flood drowns east Zuid-Beveland
- 1584 — Saeftinghe drowned during the Eighty Years' War
- 1612 — Windmills pump the Beemster dry, followed by the Purmer, Wormer, Heerhugowaard and Schermer
- 1700 — 1,196 polder windmills on record
- 25 December 1717 — Christmas Flood, about 14,000 dead around the North Sea, 2,500 in the Netherlands
- 1738–1740 — The rows of mills at Kinderdijk are built
- 1787 — Steam pumping station on the Blijdorp polder, Rotterdam
- January 1809 — Ice dams break the river dikes
- 3–5 February 1825 — Storm flood around the Zuiderzee, 379 dead
- 1832 — The cadastre records 4,242 polder windmills
- 1 July 1852 — Steam pumps the Haarlemmermeer dry
- February 1861 — The Waal dike breaks at Leeuwen
- 1890 — 295 steam pumping stations built so far
- 1900 — Still 3,747 polder windmills standing
- 14 January 1916 — Zuiderzee flood, leading to the Zuiderzee Act
- 7 October 1920 — The Wouda steam pumping station opens at Lemmer
- May 1923 — De Hollandsche Molen founded
- 1925–1926 — Record Rhine flood; 39 Meuse dikes break
- 1932 — The Afsluitdijk is closed; 960 polder windmills left
- 1 February 1953 — North Sea Flood, 1,836 dead in the Netherlands
- 1975 — IJmuiden pumping station
- 1 February 1995 — 250,000 evacuated; the river dikes hold
- 10 May 1997 — The Maeslant barrier completes the Delta Works
- 15 July 2021 — Summer flood in Limburg
- 1 October 2026 — New pumps in the Afsluitdijk; 417 polder windmills left
Watch the orange fields of mills spread over Holland and collapse in the 1920s, see the red, purple and teal dots of the pumping stations take over, or embed the map on your own site.
Explore the full interactive map →The coastline and lakes on this map come from our map of how the Netherlands lost land to the sea and won it back, from 500 BC to 2026.
Read about the land reclamation map →Frequently asked questions
- How many polder windmills were there in the Netherlands?
- By 1700, 1,196 polder windmills are on record, most of them in Holland and Utrecht. The cadastre of 1832 gives the first nationwide picture: 4,242 polder windmills, many of them small mills in Friesland that enter the record only then. Around 1880 there were 3,947, in 1900 still 3,747 and in 1920 3,186, but by 1932 only 960 were left. Today 417 complete polder windmills stand, about a tenth of the number around 1880. These figures count only mills that drained polders, not corn mills or industrial mills.
- When was the first polder windmill built?
- The oldest firm record of wind-driven drainage in Holland dates from 1408, when two councillors from Delfland travelled to Alkmaar to see the mill of Floris van Alkemade and Jan Grietensz., which 'had thrown out water'. Earlier dates that are sometimes given, 1282 and about 1326, are disputed.
- When did steam pumping stations replace windmills in the Netherlands?
- Steam was tried early: Steven Hoogendijk tested a steam engine in Rotterdam in 1776, a steam pumping station went into operation on the Blijdorp polder in 1787, and one at Mijdrecht worked from 1794 until it was shut down after 1812 because of the cost. Steam took off only after three steam stations pumped the Haarlemmermeer dry between 1848 and 1852. Of the 398 steam stations on record, 232 were founded in the 1870s and 1880s. The small mills of the north held out until diesel and electric pumps arrived after 1920.
- Why did so many Dutch windmills disappear in the 1920s?
- Diesel engines and electric pumps made them redundant. Between 1920 and 1932 the number of polder windmills standing fell from 3,186 to 960. In the twelve years after the Wouda steam pumping station at Lemmer opened in 1920, some 2,200 polder windmills disappeared from the record, most of them small mills in Friesland. In May 1923 the society De Hollandsche Molen was founded in Amsterdam to save what was left. By 1939 more pumping stations had been founded than polder windmills were left.
- Did floods lead to more pumping stations in the Netherlands?
- After the North Sea Flood of 1953 they seem to have: in Zeeland 23 pumping stations were founded in the ten years after the flood, against 4 in the ten years before, while in the rest of the country the number went from 72 to 133. The Zuiderzee flood of 1916 and the river flood of 1926 left no such mark. The numbers are small and the register is incomplete, so this is an indication, not proof.
- Is there an animated map of Dutch windmills and pumping stations?
- Yes. Moving Polygons has an animated map of the Netherlands from 1400 to 2026 that shows the density of polder windmills over time, every pumping station with a known founding year coloured by its power source (steam, diesel and gas, or electric), the lakes pumped dry in each era, and pins for the floods, dikes and machines. A bar at the top counts windmills standing against pumping stations founded. You can watch and embed it, and export it as an animated GIF.
Text version of the map (timeline, layers and events): Markdown