Animated maps of epidemics and health
Three of these maps follow an outbreak from its first cases. The Black Death map covers the first wave, from the Golden Horde in 1346 to Moscow in 1353, modelled from more than 680 dated places. The COVID-19 map runs from a pneumonia cluster in Wuhan at the end of 2019 to May 2023. The Ebola map follows the Bundibugyo outbreak of 2026 through the health zones of DR Congo.
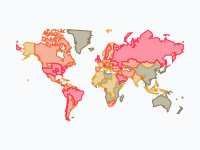
How to read them differs from map to map. On the Black Death map, land takes the colour of the half-year in which the plague arrived, and keeps it. The first part of the COVID-19 map colours each country by its new confirmed cases per million people; the second part shows the variant that made up most of the sequenced samples. Case counts depend on how much a country tests, so compare countries with care.
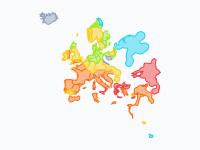
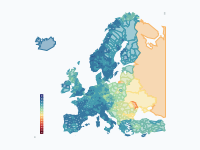
Two maps move more slowly. The Asian tiger mosquito, which can pass on dengue and chikungunya, appears region by region across Europe from 1979. Life expectancy at birth in Europe is shown for every year from 1945 to 2024, on one colour scale for all years.
5 maps
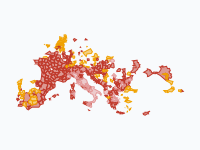
The Black Death (1346–1353)
The first wave of the Black Death, from the Golden Horde in 1346 to Moscow in 1353, modelled from more than 680 dated places. The map is an arrival-time surface: settled land takes the colour of the half-year in which…
Read the article: The Black Death: Mapping the Deadliest Pandemic in History
COVID-19: from Wuhan to the world, 2019–2023
How COVID-19 spread from a pneumonia cluster in Wuhan to every country, and how variants then took turns sweeping the world. Part 1 (Dec 2019 – Aug 2020) colours each country (provinces in China, regions in Italy…
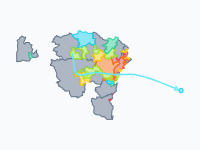
Ebola (Bundibugyo) in DR Congo, 2026
Data to 12 November 2026 (DRC health ministry / INSP daily situation report 182; WHO AFRO weekly report 25, data to 7 November). How the 2026 Bundibugyo Ebola outbreak spread through the health zones of eastern and…
Read the article: The 2026 Bundibugyo Ebola Outbreak in DR Congo, Mapped by Health Zone
Asian tiger mosquito in Europe, region by region, 1979–2026
Region by region, the spread of the Asian tiger mosquito (Aedes albopictus) in Europe, from the first European record in Albania (1979) to 2026.
Read the article: How the Asian Tiger Mosquito Spread Across Europe, 1979–2026: An Animated Map
Life expectancy in Europe, 1945–2024
How long can a newborn expect to live? Life expectancy at birth (both sexes) across Europe from 1945 to 2024, one frame per year, at the finest level each country publishes: countries first, then regions and provinces…
Make your own animated map
Pick a region and two years, and watch the borders of that time move. You need no account to try it.
Create a map