Animated maps of the Americas
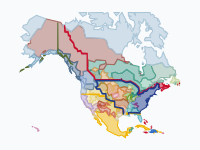
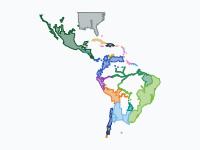
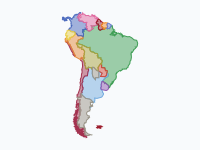
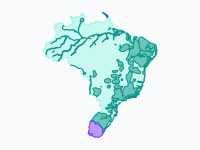
Four of these maps follow borders over centuries. One shows North America from 1492, when Native nations held the continent, through the Spanish, French, English, Dutch, Swedish and Russian footholds, to the United States, Canada and Mexico of today. The others follow the Spanish and Portuguese empires until the last Spanish garrisons surrendered in 1826, Brazil from Cabral's landfall in 1500 to the boundary treaties of 1909, and South America from the wars of independence to today.
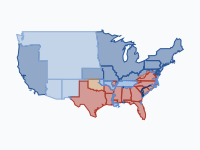
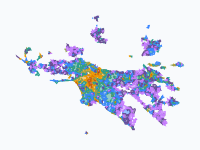
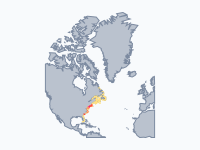
Three maps look closer. The American Civil War is drawn county by county, from Lincoln's election to the abolition of slavery. Los Angeles grows from a Spanish pueblo of 1781 into a metropolitan region, each area in the colour of the period in which it was first built up. Along the Atlantic coast, from the Florida Keys to Greenland, red patches are clusters of recorded shipwrecks and yellow dots are lighthouses and lightships.
On the map of the United States the colours show who held the ground, and ribbons mark the borders that the colonial powers claimed on paper.
7 maps
The Making of the United States, 1492–2025: Native Nations and Colonial Powers
Five centuries of North America in one animation: from a continent held wall to wall by Native nations, through the Spanish, French, English, Dutch, Swedish and Russian footholds, to the United States, Canada and…
Read the article: The Making of the United States, 1492–2025: Native Nations and Colonial Powers
Spanish and Portuguese America, 1492–1826
The Spanish and Portuguese empires in the Americas, from Columbus's first landfall to the surrender of the last Spanish garrisons at Callao and Chiloé: how Spain and Portugal conquered Middle and South America, and how…
Read the article: Spanish and Portuguese America, 1492–1826: From Conquest to Independence
South America: from the wars of independence to today, 1808–2026
In 1808 South America belonged to two crowns: Spain's viceroyalties and Portugal's Brazil. Napoleon's invasion of Iberia broke both. This map follows what came next, year by year through the wars of independence (the…
Read the article: South America from the Wars of Independence to Today, 1808–2026
Brazil — From Colony to Republic (1500–1909)
Brazil from Cabral's landfall in 1500 to the last boundary treaties of 1909: a strip of sugar coast becomes half a continent. The map follows the hereditary captaincies, the French and Dutch colonies, the bandeirantes…
The American Civil War, 1861–1865: Front Lines, Battles and Casualties
From Lincoln's election to the abolition of slavery: eleven states leave the Union, and four years of war push the Confederacy back county by county until its armies surrender in the spring of 1865.
Read the article: The American Civil War, 1861–1865: Front Lines, Battles and Casualties
Los Angeles: How the Sprawl Grew, 1781–2020
How the Los Angeles region grew from a Spanish pueblo of 44 settlers (1781) into a metro of 18.6 million. Each colour is a growth wave; areas take the colour of the period in which they first became built-up.
Read the article: How Los Angeles Sprawled, 1781–2020: An Animated Map
Lights Against the Sea: North America's Atlantic Coast Shipwrecks and Lighthouses (1715–2026)
Every red patch is a cluster of recorded shipwrecks on the Atlantic coast of North America, from the Florida Keys to Greenland, counted over the ten years before each date; every yellow dot is a lighthouse or…
Make your own animated map
Pick a region and two years, and watch the borders of that time move. You need no account to try it.
Create a map