Two Thirds Younger Than 1970
Of the 11.3 million buildings in the Dutch national building register, about two in three were built after 1970, and only about one in fifty is older than 1900. For most of the seven centuries on this map, in other words, very little happened. Around 1500 the roughly 180 towns of the Netherlands together covered about 41 km², less than a fifth of today's municipality of Amsterdam, and in 1850 most of them still sat inside the walls they had by 1700. Then, within a few lifetimes, they ran together into the Randstad.
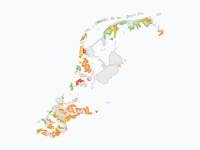
The map shows when each part of a town was built: dark red for the medieval towns, brown for the Golden Age, red for the 19th century, and through orange to pale yellow for the districts of the last thirty years. Grey-violet marks ports, heavy industry and Schiphol. At country scale the early towns are specks, so zoom in on Amsterdam, Leiden or Haarlem for the first half of the playback, then zoom out and watch the yellow flood after 1950.
Charters and Walls (1250–1500)
The first frame, labelled 1300, shows the towns that the paleogeographic maps of the Netherlands draw around 1250: about twenty, from Utrecht, the largest at 1.3 km² inside its walls, to Zierikzee, Middelburg, Dordrecht, Deventer, Zutphen, Nijmegen, Groningen and Maastricht. The decades around 1300 brought a wave of town charters (Amsterdam got its own around 1300, Rotterdam in 1340), and by 1500 the same maps count about 180 towns. Holland had become one of the most urbanised regions of Europe, with about 45% of its people living in towns in 1514, comparable to Flanders and northern Italy. Every town was still small: medieval Amsterdam, between the Singel, the Kloveniersburgwal and the Geldersekade, covered about one square kilometre.
The Golden Age, Inside New Walls (1585–1700)
When Spanish troops retook Antwerp in 1585, tens of thousands of merchants, weavers and printers moved north, and the towns of Holland and Zeeland had to make room. Amsterdam expanded four times: in 1585 (the Lastage and a strip out to the Herengracht), around 1593 (the islands of Vlooienburg, Uilenburg, Rapenburg and Valkenburg), from 1613 (the western canal ring and the Jordaan) and from 1658 to 1663 (the canal ring from the Leidsegracht to the Amstel and beyond, the Plantage and the eastern islands where the Admiralty and the VOC built their yards). On the map the walled town grows from about 1 km² to 4 km², while the population rose from about 65,000 in 1600 to 175,000 in 1650 and some 200,000 around 1700.
The same story played out on a smaller scale elsewhere. Rotterdam dug the harbours of its Waterstad between 1598 and 1615, Middelburg got a ring of thirteen bastions in the 1590s, Enkhuizen a new western quarter around 1600, Groningen its northern and eastern expansion between 1608 and 1624, Leiden new quarters in 1611, 1644 and 1659, and Haarlem its Nieuwstad from 1671. Every expansion ended at a new moat and earthen bastions. By 1622 nearly 60% of Holland's people lived in towns.
Two Centuries of Standstill (1700–1870)
After the boom, nothing moved. Amsterdam had about 200,000 people around 1700, 217,000 in 1795 and 224,000 in 1849, and its built area hardly grew from about 1680 until the second half of the 19th century: on the map the frames of 1700, 1800 and 1850 are the same. Most other towns stayed inside the walls of 1700 as well; many were fortresses, and the land outside the ramparts had to stay open as a field of fire. In 1850 the Netherlands had 3.06 million people, and all its towns together covered about 46 km² on the map.
Breaking Out (1870–1940)
The first railway had run from Amsterdam to Haarlem in 1839, but the break-out came in the 1870s, with industry, a growing population and the Fortress Act of 1874, which released dozens of fortress towns such as Nijmegen, Breda, 's-Hertogenbosch and Groningen from their ramparts. Private speculative builders put up whole districts around the old towns, often of poor quality; the Dutch called it revolutiebouw. De Pijp, the Dapperbuurt and the Kinkerbuurt in Amsterdam, the Oude Westen in Rotterdam and the Schilderswijk in The Hague all date from these decades. On the map the red ring of the 19th century appears between 1875 and 1900: the built-up area doubles from about 46 km² in 1850 to nearly 100 km² in 1900, and Amsterdam's grows from 4 to about 12 km².
The Housing Act of 1901, in force from 1902, changed the rules: towns of more than 10,000 people had to make an expansion plan and revise it at least every ten years, and housing associations could build with state loans. The result was the brick working-class districts and garden villages of the 1910s and 1920s, such as the Spaarndammerbuurt in Amsterdam and Tuindorp Vreewijk in Rotterdam. Between the wars about 40,000 to 50,000 homes were built a year, with a peak of 52,591 in 1934. By 1940 the map shows about 300 km² of built-up land. On 14 May 1940 German bombers destroyed about 2.6 km² of Rotterdam's centre and 24,978 homes.
From Housing Shortage to VINEX (1945–2025)
After the war the housing shortage was the country's most pressing domestic problem, and building never stopped for long after that. In the 1960s industrialised system building put up flats and high-rise estates on the edges of every town, and in 1973 the Netherlands built 157,460 new homes, a record that still stands. The Second Memorandum on Spatial Planning of 1966 chose bundled deconcentration to keep the Green Heart open, and in the 1970s the government designated growth towns such as Zoetermeer, Nieuwegein, Houten and Purmerend and the new towns on the IJsselmeer polders, Lelystad and Almere, where the first residents arrived in 1976.
From the mid-1990s the VINEX policy placed new districts right against the existing cities: Leidsche Rijn, IJburg, Ypenburg, Vathorst and dozens more, about 400,000 homes in total by CBS count. Measured by the buildings that stand today, the built-up area on the map grows from about 350 km² in 1950 to 1,000 km² in 1970, 3,100 km² in 2000 and 4,200 km² in 2025, while the population went from 10.0 million to 18.0 million. Each of the two periods since 1970 left about 3.7 million buildings. The growth has not stopped: in 2024 the country was short of about 400,000 homes, and the national target is 900,000 new homes by 2030.
How to Read the Map
Each colour is a building period, and an area keeps the colour of the period in which it was first built up: dark red before 1500, brown 1500–1800, red 1800–1900, orange-red 1900–1945, orange 1945–1970, light orange 1970–1995 and pale yellow 1995–2025. Grey-violet areas are ports, heavy industry and Schiphol. The small dark dots are city labels with their population through the centuries. The pins tell the events behind each wave, from the fall of Antwerp to the housing shortage of the 2020s.
The timeline runs in proportion to time, so the quiet centuries before 1850 still take about half of the playback, although they have been cut to seven frames. That half is best watched zoomed in: step from 1500 to 1600, 1650 and 1700 over Amsterdam and see the canal ring close around the medieval town. Villages are drawn once their built-up area reaches about one square kilometre, so most of the countryside stays blank.
How the Map Was Made
The towns up to 1850 come from the paleogeographic maps of the Netherlands by Vos and colleagues (Atlas van Nederland in het Holoceen, Rijksdienst voor het Cultureel Erfgoed), which draw town outlines for about 1250, 1500 and 1850. Growth between the outlines of 1500 and 1850 is kept only where buildings from before 1870 still stand, so that bare bastions and empty land inside the walls drop out, and is dated town by town from the Monumenten Inventarisatie Project and town histories. Amsterdam's expansions follow its CBS districts, and Rotterdam's Waterstad, burnt out in 1940, follows the CBS neighbourhood of the Stadsdriehoek.
From 1850 on, the map uses the construction year of every building in the Basisregistratie Adressen en Gebouwen (BAG), the national register kept by the Kadaster, in the edition of 1 November 2026. On a 100-metre grid, land counts as built-up in a given year once the footprints of buildings standing today and built by then cover enough of it. Because the BAG only knows buildings that still stand, the 19th-century districts that were demolished later (much of old Rotterdam, for instance) would be missing; the built-up blocks of the coloured Bonne sheets of about 1890 and 1900 (Kadaster, via Topotijdreis) fill them in. Some districts that were cleared and rebuilt after 1900 still appear later than they were first built, and the frames before 1940 are on the small side. Some 870 buildings, nearly all in the centre of Amsterdam, carry the impossible construction year 1005 in the BAG, a known error; they simply count as old. Greenhouses are left out, and the ports, industry and Schiphol are the land-use outlines of CBS for 2017, staged by period.
Chronological Timeline
- c. 1250 — About twenty walled towns; Utrecht the largest
- c. 1300 — Wave of town charters; Amsterdam gets its rights
- 1340 — Rotterdam receives town rights
- 1514 — About 45% of Holland's people live in towns
- 1585 — Fall of Antwerp; Amsterdam expands to the Herengracht
- 1613 — Amsterdam starts the western canal ring and the Jordaan
- 1658–1663 — The canal ring is extended to the Amstel and beyond
- 1671 — Haarlem lays out its Nieuwstad
- 1839 — First Dutch railway, Amsterdam–Haarlem
- 1874 — Fortress Act frees the fortress towns
- 1902 — The Housing Act of 1901 comes into force
- 1934 — Interwar peak: 52,591 new homes
- 14 May 1940 — Rotterdam's centre destroyed
- 1966 — Second Memorandum on Spatial Planning
- 1973 — Record year: 157,460 new homes
- 1976 — First residents in Almere
- 1993 — VINEX policy adopted
- 2024 — The country is short of about 400,000 homes
Zoom in on your own town and step through the frames, or click the city dots for their population through seven centuries.
Explore the full interactive map →Almere stands on a polder that fell dry in 1968. How the Netherlands made its land, from 500 BC to today.
Read about the land reclamation map →Frequently asked questions
- When did Dutch cities start to grow outside their walls?
- Mostly after 1870. Amsterdam reached its Singelgracht in 1663 and did not grow beyond it for two centuries; most fortress towns stayed inside their ramparts until the Fortress Act (Vestingwet) of 1874 released them. Railways, industry and private speculative builders then filled the land around the old towns, and after the Housing Act came into force in 1902, towns of more than 10,000 people had to plan their expansions.
- How big was Amsterdam in the Golden Age?
- Around 1500 the walled town covered about one square kilometre. Four expansions, in 1585, around 1593, from 1613 and from 1658 to 1663, quadrupled it to about four square kilometres inside the Singelgracht, with the canal ring, the Jordaan, the Plantage and the eastern islands. The population grew from about 65,000 in 1600 to some 200,000 around 1700, and in 1849 it was still only 224,000.
- What were the Dutch growth towns (groeikernen)?
- Towns chosen by the government in the 1970s to take the overspill of the big cities, so that the open Green Heart between them stayed open. The Second Memorandum on Spatial Planning of 1966 set out the idea of bundled deconcentration; the list of about twenty towns came with the Urbanisation Memorandum of 1976–1978 and included Zoetermeer, Nieuwegein, Houten, Purmerend, Haarlemmermeer, Almere and Lelystad.
- What is a VINEX district?
- A large new housing district built from the mid-1990s right against an existing city, under the Fourth Memorandum on Spatial Planning Extra (VINEX), presented in 1990–1991 and adopted in 1993. Examples are Leidsche Rijn in Utrecht, IJburg in Amsterdam, Ypenburg near The Hague and Vathorst in Amersfoort. By CBS count about 400,000 homes were built in the VINEX districts.
- How old are the buildings in the Netherlands?
- Young. Of the 11.3 million buildings in the national building register (BAG) in November 2026, about two in three were built after 1970 and only about one in fifty before 1900. The record year for new homes was 1973, with 157,460.
- Is there an animated map of how Dutch cities grew?
- Yes. Moving Polygons has a free animated map that shows the towns of the Netherlands growing from 1300 to 2025 in 24 steps, coloured by the period in which each part was built, with population figures for 29 cities and pins for events such as the fall of Antwerp, the Fortress Act, the Housing Act and VINEX. You can watch it and embed it on your own website.
Text version of the map (timeline, layers and events): Markdown