Quito and Manaus both lie within a few degrees of the equator, and they get roughly the same sunshine. Yet in Manaus, in the Amazon rainforest, the average temperature never drops below 26 °C, while in Quito, high in the Andes, it never gets above 12 °C. Yakutsk in Siberia averages −39 °C in January and +19 °C in July: a difference of almost 60 degrees between winter and summer. Mumbai gets almost no rain from December to April and then close to a metre of it in July alone. Climate is not one thing per country: it changes from valley to mountain, and from month to month.
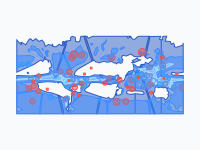
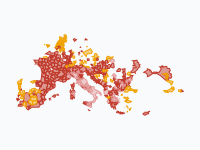
This map shows that, for the whole world at once. Every month the land is coloured by two things: the average temperature of that month and the average rain (or snow) of that month. Places with the same combination that lie next to each other form one area. Play the map and the areas move with the seasons, and after December the year starts again. It was made for geography lessons (for students of about 12 to 16), so each month has one caption with one idea, and the city dots give the real numbers.
How to Read the Colours
The colour is the temperature, from cold to hot: violet and blue are frost, teal is cool, green is mild, yellow is warm, red is hot and pink is scorching. The shade is the rain: a light shade means a dry month, a medium shade a moist month and a dark shade a wet month. So dark red is hot and wet (a tropical rainforest in its rainy season), and pale orange is hot and dry (a desert, or a savanna in its dry season). The Legend button under the map description opens all sixteen classes; click a class to hide or show it.
- Severe frost: below −10 °C
- Frost: −10 to 0 °C, dry (under 30 mm) or snowy
- Cool: 0 to 10 °C, dry, moist or wet
- Mild: 10 to 18 °C, dry, moist or wet
- Warm: 18 to 24 °C, dry, moist or wet
- Hot: 24 to 30 °C, dry, moist or wet
- Scorching: above 30 °C
Dry means less than 30 millimetres of rain in the month, moist 30 to 100 millimetres and wet more than 100 millimetres. (One millimetre of rain is one litre of water on every square metre.) The coldest and hottest classes are not split by rain: in severe frost almost nothing falls anyway, and scorching months are nearly always dry.
Frost That Comes and Goes
In January a huge area of frost covers the north: most of Canada and Siberia averages below −10 °C. From March the frost line starts to move north, and by July almost all of the frost in the northern half of the world has gone (what is left is about 3 per cent of the January area, mostly Greenland's ice sheet and the highest mountains). Even the Arctic tundra thaws for a few weeks.
Then it comes back, and fast. In September only a few per cent of Siberia has frost; one month later, in October, it is more than 70 per cent. Canada goes from about 7 per cent to more than half. Land far from the sea cools quickly once the days get shorter, because there is no warm ocean nearby to hold the heat. Compare Moscow, deep inland, with Amsterdam, a little further south but next to the North Sea: in January Moscow averages −7 °C, Amsterdam +3 °C.
The Rain Belt Follows the Sun
Near the equator, the sun heats the ground so strongly that warm, wet air rises and rains almost every afternoon. This band of rising air is the tropical rain belt (geographers call it the Intertropical Convergence Zone). It is not fixed: it follows the sun north and south during the year. In February, the wet colours cover most of the tropics south of the equator: the Amazon, southern Africa and northern Australia are in their rainy season. In July and August the belt has moved north, over West Africa, India and South-East Asia, and the south dries out.
You can measure it on the map. Over Africa, the middle of the wet belt lies at about 10 degrees south in January and February, reaches the equator in April and about 8 degrees north in July and August, is back near the equator in October and is south of it again in November. Places on the edge of the belt, like Timbuktu at the edge of the Sahara, get rain only for the few months when the belt reaches them: in Timbuktu that is July and August, and the rest of the year is dry.
India: Scorching, Then the Monsoon
The hottest months in northern India are May and June, not July. On the map, in May, more than 80 per cent of northern India is scorching (above 30 °C on average) and dry. Then the monsoon arrives. Wet ocean air is pulled in over the hot land, the wet colours spread from the south-west coast in June, and by July three quarters of India gets more than 100 millimetres of rain in the month. Clouds and rain cool the land a little, so July is cooler than May. Mumbai shows the extremes best: 0 to 2 millimetres a month from December to April, and 976 millimetres in July.
Mountains Stay Cool
Mountains show up on the map in every month, as cooler colours in the middle of warm ones. Air gets colder as you go up, by about 6.5 °C for every 1,000 metres. That is why the Andes are a thin teal and green band between the hot Amazon and the Pacific, why the Ethiopian Highlands are mild while the lowlands around them are hot, and why Tibet stays cool in summer while India below it is hot. Nairobi, almost on the equator at 1,800 metres, has warm but never hot months: 17 to 21 °C.
Height also changes the rain. Mountains force wet air to rise and rain on the side the wind comes from, and leave the other side dry. Lima, on the coast of Peru, lies in the tropics and next to the ocean, but gets 2 to 4 millimetres of rain in each month: the coast is a desert. A cold ocean current cools the air above it, and the Andes block the wet air from the Amazon. Our water cycle map shows how that works.
Seasons the Other Way Round
South of the equator the seasons are reversed, because the Earth is tilted: in June the north leans towards the sun and the south leans away. Sydney is warmest in January and coolest in July. Cape Town and Rome both have a Mediterranean climate (dry summers, wet winters), but at opposite times of the year: Rome is driest in July, Cape Town in February, and Cape Town's wettest month is July. Vostok Station in Antarctica is coldest in August, at −62 °C on average: deep in the southern winter.
Ideas for a Lesson
Pause the map in January and in July and compare the two: which areas change the most, and which hardly change at all? (The answer to the second question is mostly the wet tropics near the equator, and Antarctica.) Ask students to find a mountain range by its colour alone. Let each student choose one city dot, read its numbers, and describe its climate in one sentence; then check whether the map colours agree. For older students: follow a place through all twelve months and try to give it a Köppen climate type.
How the Map Was Made, and What It Cannot Tell You
The numbers come from CHELSA V2.1, a set of world climate maps made by the Swiss Federal Research Institute WSL (Karger and others, 2017, Scientific Data). It gives the average temperature and rain of every month, over the thirty years 1981 to 2010, for squares of about one kilometre, worked out from weather stations, weather models and the shape of the land (which is how it knows that a mountain top is colder than the valley below). For this map the squares were averaged to about 10 kilometres, and every square got one of the sixteen classes for every month.
Areas smaller than about 40 kilometres across are merged into their surroundings, and the borders are slightly simplified, so the map does not show every valley. The dates on the map stand for the middle of each month. These are averages, not the weather of one year: a real month can be warmer, colder, wetter or drier. And the class limits (0, 10, 18, 24 and 30 °C; 30 and 100 millimetres) were chosen for this map so the changes are easy to see; they are not an official classification. Each city dot gives its own numbers for the 10-kilometre square around it, which can differ a little from the official weather station of that city.
The Year on the Map
- January — Deep frost from Canada to Siberia
- February — Wet, hot summer south of the equator
- March — The frost line starts to move north
- April — Spring: the north thaws
- May — India scorches before the monsoon
- June — The monsoon rains reach India
- July — The Sahara scorches, the tundra thaws
- August — The rain belt at its northern limit
- September — The north starts to cool
- October — Frost returns to Siberia and Canada
- November — The rain belt moves south again
- December — Winter is back in the north
Pause the map in March, zoom in on South America, and compare the dark red Amazon with the cool Andes next to it. Then jump to October and watch the frost return to Siberia.
Explore the full interactive map →Why does it rain in the Amazon and not in the Atacama? The water cycle map follows the water from the ocean to the rain.
Read about the water cycle map →Frequently asked questions
- What is the difference between weather and climate?
- Weather is what the air does on one day or in one week: sun, rain, a cold snap. Climate is the weather you can expect, worked out as an average over many years (usually thirty). A real January in Amsterdam can be colder or warmer than its climate says; the climate tells you what a January there is usually like.
- Why is it cold in the Andes when the Amazon next to it is hot?
- Because of height. Air gets colder the higher you go, by about 6.5 °C for every 1,000 metres. Manaus, in the Amazon close to sea level, averages 26 to 28 °C in every month. Quito, almost on the equator too but at 2,850 metres, averages 11 to 12 °C all year. On the map the Andes stay a thin cool band next to the hot, wet Amazon in every month.
- Why does the tropical rain belt move during the year?
- It follows the sun. Near the equator the sun heats the ground so strongly that warm, wet air rises and rains. The place where the sun is highest moves north of the equator in June and south of it in December, and the rain belt moves with it, a few weeks later. On the map, the wet belt over Africa lies at about 10 degrees south in January and at about 8 degrees north in July and August.
- What is the monsoon?
- A wind that turns around with the seasons. In winter it blows from the dry land of South Asia out to sea, and India gets little rain. In late spring the land gets much hotter than the Indian Ocean, and wet ocean air is pulled in over the land. On the map, northern India is scorching and dry in May; in June the wet colours arrive, and by July three quarters of India gets more than 100 millimetres of rain in the month. Mumbai gets almost 1,000 millimetres in July alone.
- Why are the seasons the other way round south of the equator?
- Because the Earth is tilted. In June the northern half of the Earth leans towards the sun, gets more sunlight and has summer, while the southern half leans away and has winter. In December it is the other way round. That is why Sydney is warmest in January and coolest in July, and why Cape Town gets most of its rain in June, July and August, its winter.
- How is this map different from the Köppen climate map?
- The Köppen classification gives every place one climate type for the whole year, based on the pattern of its twelve months (for example 'tropical rainforest' or 'Mediterranean'). This map shows each month separately, so you see the year happen. If you follow one place through the twelve months, you see the pattern Köppen sums up in a single type: Rome is hot and dry in July and cool and moist to wet in winter, which is what Köppen calls a Mediterranean climate.
- Is there an animated map of the world's climate month by month?
- Yes. Moving Polygons has a free animated map, A Year of World Climate: Temperature and Rain, Month by Month. It loops through a typical year, colouring the land by the average temperature and rain of each month (averages of 1981 to 2010). Twenty-one city dots, from Manaus and La Paz to Yakutsk and Vostok Station, give their own numbers. It is made for geography lessons for students of about 12 to 16. You can watch it, embed it on your website or export it as an animated GIF.
Text version of the map (timeline, layers and events): Markdown