Ireland and the Sahara get their water from the same place: the sea. Ireland is famously green, and in the west it rains on more than half the days of the year. Large parts of the Sahara get less than 25 millimetres of rain in a year, and some places go years without any. Yet wet ocean air blows over both. The difference is not how much water is in the air, but what the air does: whether it rises (and rains) or sinks (and stays dry).
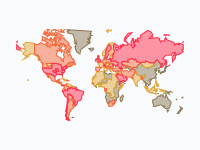
This map shows that system at work, over one typical year that keeps repeating. Red dots are water that has just evaporated, mostly from the warm oceans. Each red flock rides the wind. Where the air has to rise, over mountains or where winds meet, it cools, clouds form and the flock turns blue: the water falls as rain or snow. The still, twinkling blue dots show where it rains at that time of year. It was made for geography lessons (for students of about 12 to 16), so every caption explains one idea, and the pins tell the story of eleven places.
Warm Air Rises, Cool Air Rains
Almost everything on the map follows from one rule: warm air can hold much more water vapour than cold air. Air that rises gets colder (it expands as the pressure drops), so it can hold less water. The extra water condenses into droplets, which make clouds, and when the droplets grow big enough they fall as rain, or as snow when it is cold enough. Air that sinks does the opposite: it gets warmer and drier, and clouds dissolve.
So the question 'where does it rain?' is really the question 'where does air rise?'. There are three main answers. Air rises where the sun heats the ground most, near the equator. It rises where it is forced up a mountain range. And it rises where warm and cold air meet, in the depressions (low-pressure areas) of the middle latitudes. Watch for all three on the map.
The Rain Belt and the Deserts Beside It
Near the equator the sun heats the ground and the sea so much that warm, wet air rises almost every afternoon, in towering thunderclouds. This band of rising air is called the Intertropical Convergence Zone (ITCZ), and on the map it is the long blue belt around the middle of the world. It does not stay in one place: it follows the sun. In January it lies south of the equator, bringing the rainy season to the Amazon, southern Africa and northern Australia. In July it has moved north, over West Africa, India and South-East Asia.
The air that rises in the rain belt has to come down somewhere. High up it flows towards the poles and sinks again around 20 to 30 degrees north and south (this loop of rising and sinking air is called the Hadley cell). Sinking air warms up and dries out, so the sky stays clear. That is where most hot deserts are: the Sahara, Arabia, the Kalahari and the Australian outback. On the map, red flocks do pass over the Sahara, but they do not turn blue there. The Sahel, the strip just south of the Sahara, gets rain only in July, August and September, when the rain belt reaches its most northern point. A few hundred kilometres further north, it never arrives.
Those dry belts are also where the most water evaporates. Over the subtropical oceans the sun is strong, the sky is clear and the dry trade winds blow steadily over warm water, so the sea gives off a lot of water vapour. The trade winds carry it back towards the equator, where it rises and rains. Watch the red flocks that start over the open ocean on both sides of the rain belt and drift towards it.
The Monsoon: When the Wind Turns Around
Land heats up and cools down much faster than water. In winter the land of South Asia is cooler than the Indian Ocean, the wind blows from the land out to sea, and India is dry. In April and May the land gets very hot, much hotter than the ocean. The hot air over India rises and pulls in air from the sea: the wind turns around. That ocean air is full of water. In June the monsoon 'bursts' over the south-west coast, and by July it covers almost the whole country. Most of India gets most of its rain for the year between June and September.
Follow the red flocks from late May. Many of them start south of the equator, over the southern Indian Ocean, sweep north along the coast of East Africa, turn east over the Arabian Sea and run into India. The last stop is the Himalaya. The wet air has to climb the highest mountains in the world, and on their southern slopes it rains enormously: Cherrapunji, in the hills of north-east India, gets almost 12 metres of rain in an average year. Behind the mountains lies a rain shadow. The Tibetan Plateau, the Taklamakan and the Gobi get very little rain: the Himalaya has taken the water out of the air, and they are also very far from any ocean. They are cold deserts: dry, with freezing winters.
Mountains Wring the Air Out
The Himalaya is the most dramatic example, but the same thing happens wherever wet air meets mountains. The side the wind comes from (the windward side) gets the rain; the other side (the leeward side) is in the rain shadow. In South America the trade winds carry water from the Atlantic across the Amazon to the Andes, where it rains out. On the other side lies the Atacama, the driest non-polar desert in the world. It has a second reason to be dry: a cold ocean current along the Pacific coast cools the air from below, and cold air picks up little water. In parts of the Atacama years pass without any rain.
Further south the winds blow the other way. In Patagonia the west winds come from the Pacific, drop their rain on the Chilean side of the Andes, which is one of the wettest places in South America, and come down dry on the Argentine side. In North America, Pacific storms drop their rain and snow on the mountains of California, and behind them lies the desert of the Great Basin, in Nevada and Utah.
Ireland and the West Winds
Between about 40 and 60 degrees north and south, the winds blow mostly from the west. Along with them travel the depressions: big swirls where warm, wet air from the south is lifted over cold air from the north, and it rains. North-west Europe lies at the end of a very long stretch of ocean in this belt. Ireland is the first land the west winds meet, and their air has crossed thousands of kilometres of water. That is why Ireland, western Scotland, Wales and western Norway are so green, and why the west coasts are wetter than the east.
The depressions are strongest in autumn and winter, when the difference in temperature between the tropics and the Arctic is greatest. On the map, from October to March, red flocks stream across the North Atlantic and turn blue over Europe. In summer the stream gets weaker, and around the Mediterranean the air sinks: southern Europe has dry summers and wet winters.
Forests Make Rain Too
Not all evaporated water comes from the sea. Plants pull water from the ground and give it off through their leaves (this is called transpiration). A rainforest gives off so much that it makes a large part of its own rain. In the Amazon the trade winds bring water from the Atlantic; it rains, the trees send much of it back into the air, the wind carries it further west, and it rains again. The same water can fall several times before it reaches the Andes. This is one reason why cutting down large parts of a rainforest can make the region drier. On the map, look for the red flocks that start over the Amazon and Central Africa as well as over the sea.
How to Read the Map
The map loops through one typical year; the date wheel at the bottom right goes round once a year, with the months around it. Dark blue dots show where it rains at least 2.5 millimetres a day at that time of year (about 75 millimetres a month); light blue dots show heavy rain, 7.5 millimetres a day or more. The red dots are flocks of evaporated water. Each flock rises where evaporation is strong, flies with the wind and fades to blue where its water has rained out. Orange pins mark dry places and blue pins wet ones; click a pin to read why.
For a lesson, try pausing at these moments. Mid-January: the Atlantic storms over Europe, and the rain belt south of the equator. Late May and June: the winds over the Arabian Sea turn and the monsoon reaches India. July: the Himalaya, Tibet and the Gobi, and the Sahel compared with the Sahara. Any time of year: the Andes, with the Amazon on one side and the Atacama on the other. Students can also follow a single red flock from where it starts to where it rains, and explain why it turns blue there.
How the Map Was Made, and What It Cannot Tell You
The rain and snow are measured. They come from two long-term datasets of monthly precipitation, both averaged over 1991–2020: GPCP v2.3 (NOAA and the University of Maryland, combining satellite and rain-gauge data, used for the oceans) and GPCC Full Data Monthly v2020 (the Deutscher Wetterdienst's worldwide collection of rain gauges, used for land, on a half-degree grid). The months are blended into 72 steps of about five days each, so the rain belt moves smoothly.
The red flocks are a model. Evaporation, humidity and winds come from the NCEP/NCAR Reanalysis 1 (long-term monthly averages for 1991–2020), all provided by the NOAA Physical Sciences Laboratory. Every flock starts where evaporation is strong at that time of year and follows the average wind that carries water vapour (the wind weighted by how much water it carries, from the ground up to about 9 kilometres). Along the way it loses water where it rains, and where the air it moves into can hold less water, because it is higher or colder. When it has lost most of its water, it turns blue: it has rained out. Of the 1,004 journeys on the map, 878 end that way; the rest are still red when they fade.
That model has limits. It uses average winds, so it shows the main routes of water, not real weather: real water vapour moves in storms and gusts, and a single day can look very different. One flock stands for an enormous amount of water, and the number of flocks does not show how much evaporates. A real journey of water vapour takes about nine days on average; on the map a journey covers up to eleven days of wind, stretched over two to three weeks of the wheel so you can follow it. And the map stops at about 56 degrees south and 70 degrees north, so the polar regions are not shown.
The big numbers in this post come from global water budgets, such as Oki and Kanae (2006, Science): roughly 500,000 cubic kilometres of water evaporate every year, more than four fifths of it from the oceans, and about a fifth of all rain and snow falls on land. Estimates differ by a few per cent between studies.
The Year on the Map
- January — Winter storms carry Atlantic water to Europe
- February — South of the equator: the rainy season in full swing
- March — Sahara: the air sinks, so clouds cannot form
- April — The rain belt follows the sun north
- May — India heats up and the sea winds start to turn
- June — Monsoon: wet ocean air floods into India
- July — The Himalaya stops the rain; Tibet and the Gobi stay dry
- August — Rain reaches the Sahel, but not the Sahara
- September — The monsoon retreats and the rain belt turns south
- October — The Andes: a wet Amazon side and a bone-dry Atacama side
- November — Storm season returns to western Europe
- December — Forests make rain too: the Amazon reuses its water
Pause the map in July and compare three places: India under the monsoon, Tibet behind the Himalaya, and the Sahara under sinking air. Then jump to January and watch the Atlantic storms reach Ireland.
Explore the full interactive map →Another map in the same style: a year of deer migrations in Sweden, from the Great Moose Migration to the reindeer treks of the Sámi.
Read about the deer migration map →Frequently asked questions
- Why is the Sahara so dry?
- Because the air above it sinks. Warm air rises near the equator, cools and loses its water as rain. High up it flows towards the poles and comes down again around 20 to 30 degrees north and south. Sinking air gets warmer and drier, so clouds cannot form, even when there is water vapour in it. The Sahara, Arabia, the Kalahari and the Australian outback all lie in these two belts of sinking air.
- What is a rain shadow?
- The dry side of a mountain range. Wet air that blows against mountains has to climb; rising air cools, and cool air can hold less water, so the water falls as rain or snow on the side the wind comes from. The air that comes down on the other side has lost most of its water. The Tibetan Plateau behind the Himalaya, the Atacama behind the Andes (seen from the Amazon), the Argentine side of Patagonia and the Great Basin of Nevada and Utah behind the Sierra Nevada are all rain shadows.
- What causes the monsoon in India?
- Land heats up faster than the sea. In winter the wind blows from the cool, dry land out to sea, and India gets little rain. In late spring the land gets much hotter than the Indian Ocean, the warm air over it rises and pulls in air from the ocean: the wind turns around. That ocean air is full of water, and from June to September it brings most of India's rain for the year, until it reaches the Himalaya, where the last of it is wrung out.
- Why does it rain so much in Ireland?
- Ireland lies in the belt of west winds, and it is the first land those winds meet after thousands of kilometres of Atlantic Ocean. The air arrives full of water, and the depressions (low-pressure areas) that travel with the west winds make it rise and rain. They are strongest in autumn and winter, which is why the wettest months in north-west Europe are in the cold half of the year.
- Where does the water in rain come from?
- Most of it evaporates from the oceans: more than four fifths of all the water that evaporates on Earth comes from the sea, and most of it falls back into the sea as rain. About a fifth of all rain and snow falls on land. Plants and forests send water back into the air too: in the Amazon a large part of the rain is water that the forest itself has given off.
- How long does water stay in the air?
- About nine days on average, between evaporating and falling as rain or snow. In that time the wind can carry it hundreds or thousands of kilometres.
- Is there an animated map of the water cycle and where rain comes from?
- Yes. Moving Polygons has a free animated map, Where the rain comes from: the water cycle in one year, that loops through a typical year. Red flocks of dots are evaporated water riding the wind; they turn blue where it rains, and still blue dots show where it rains at that time of year. Pins explain the Sahara, the Sahel, the Indian monsoon, the Himalaya, Tibet and the Gobi, Ireland, the Amazon, the Atacama, Patagonia, the Great Basin and the Australian outback. It is made for geography lessons for students of about 12 to 16. You can watch it, embed it on your website or export it as an animated GIF.
Text version of the map (timeline, layers and events): Markdown