From Four Ships off Banten to Six Islands in the Caribbean
On 22 June 1596 four Dutch ships anchored off Banten on Java, almost fifteen months out of Texel. Of the 249 men who had sailed, 87 got home, but the route to the spices was proven, and six years later the merchants behind such voyages were merged into one company with the right to wage war and make treaties in Asia.
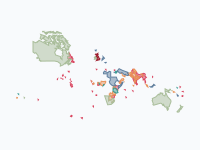
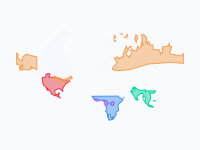
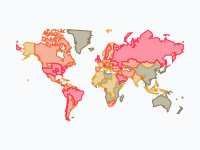
The map follows the Dutch overseas world from the Republic of 1588 to today's Kingdom of the Netherlands in 113 steps. Most of it was small: forts and islands held for trade and taken by force. The Indonesian archipelago is the part to watch: it takes three centuries to turn orange and four years, 1945 to 1949, to be lost.
Two Companies and Their Forts, 1602–1641
The Dutch East India Company (VOC), founded on 20 March 1602, had the monopoly east of the Cape of Good Hope; the West India Company (WIC) followed on 3 June 1621 for West Africa and the Americas. In Asia the map lights up one harbour at a time: Ambon, taken from the Portuguese in 1605, Batavia, which Jan Pieterszoon Coen founded on Java in 1619, Fort Zeelandia on Formosa in 1624 and Malacca in 1641.
The black pin on the Banda Islands marks what the nutmeg monopoly cost. In March 1621 Coen landed on Lontor with more than 1,600 soldiers. Of an estimated 15,000 islanders about 1,000 remained; the others were killed, starved, fled or were enslaved and shipped to Batavia, and the VOC resettled the islands with enslaved workers.
In 1628 the WIC's admiral Piet Hein captured the Spanish silver fleet in Matanzas Bay, and the money paid for the invasion of Brazil: Olinda and Recife fell in February 1630, and by 1641 Dutch Brazil is at its widest on the map. Sugar needed labour, and the same frames show where the company went for it: Elmina on the Gold Coast, taken from Portugal on 29 August 1637, and Luanda in 1641. Curaçao, taken in 1634, became its depot for enslaved Africans sold on to the Spanish colonies. Until the trade was banned in 1814, Dutch ships carried well over half a million enslaved Africans across the Atlantic, about 5 per cent of the whole trade; by the SlaveVoyages estimates more than 550,000 were embarked and about 475,000 survived the crossing.
Brazil and New Netherland Lost, 1645–1674
The Atlantic empire was at its largest for only a few years. Portuguese planters rose in June 1645, and the map shrinks Dutch Brazil to a strip of coast around Recife. Portugal retook Luanda in 1648, Recife surrendered on 26 January 1654, and in 1661 the Republic gave up its claim for an indemnity.
New Netherland went the same way. An English squadron took New Amsterdam in September 1664, and the Peace of Breda of 31 July 1667 let each side keep what it held: England kept New Netherland, the Republic kept Suriname, which Abraham Crijnssen had taken that February. A Dutch fleet retook New York in August 1673 and renamed it New Orange; the Treaty of Westminster gave it back in February 1674. What remained in the Americas was six Caribbean islands and the Guianas, above all Suriname, whose plantations ran for two centuries on the labour of enslaved Africans.
Ceylon, Java and the Cape, 1638–1795
In Asia the VOC kept growing. On Ceylon it took the coast from Portugal fort by fort, from Batticaloa in 1638 to Jaffna in 1658. Its one large loss was Formosa, where the Ming loyalist Koxinga expelled the company in 1662 (the only teal on the map). On Java the orange spreads out from Batavia as Mataram cedes the west in 1705 and the north coast in 1743. Batavia has a black pin of its own: between 9 and 22 October 1740 VOC soldiers and other townsmen killed at least 10,000 of the city's Chinese inhabitants.
In 1652 Jan van Riebeeck founded a supply station for the company's ships at the Cape of Good Hope. It grew into a colony of settlers, and the map shows it spreading over the land of the Khoikhoi until, by 1786, it reaches the Fish River and the Xhosa.
Britain Takes the Pieces, 1795–1824
French armies overran the Republic in January 1795, which made its colonies enemy territory for Britain: within a year the map turns the Cape, Malacca, Cochin, Ceylon and Demerara red. On Curaçao that August an enslaved man named Tula led a revolt of about 2,000 people; it was put down after a month, and he was tortured to death. The bankrupt VOC lost its charter on 31 December 1799, and the state took over.
The Peace of Amiens of 1802 returned everything except Ceylon, and the next war took most of it away again, the Cape in January 1806 and Java in September 1811. In the Convention of London of 13 August 1814 Britain handed back the East Indies, Suriname and the islands but kept the Cape, Essequibo, Demerara and Berbice. The handover took years: Malacca came back on 21 September 1818 and Padang on Sumatra on 22 May 1819. In the Anglo-Dutch Treaty of 17 March 1824 the Dutch gave up Malacca and their posts in India, and the British left Sumatra. From then on the Dutch empire in Asia was the Indonesian archipelago.
A Colonial State in the Indies, 1825–1942
The company's ports now became a state that conquered its hinterland. The Java War against Prince Diponegoro (1825–1830) killed an estimated 200,000 Javanese, and when it ends the whole island is orange. From 1830 the Cultivation System obliged Javanese villages to grow coffee, sugar and indigo for the government; the profits went to the Dutch treasury, and on Java the system meant forced labour and, in the 1840s, famine. The outer islands followed war by war: West Sumatra in 1837, north Bali in 1849, Banjarmasin in 1860, Aceh from 1873 in a war that lasted thirty years, south Bali and Sulawesi in 1906. The frame of 1910 is captioned 'Dutch East Indies at its height'.
Slavery ended in Suriname and on the Caribbean islands on 1 July 1863: about 33,000 people in Suriname and about 12,000 on the islands were freed. The owners were compensated and the freed were not, and in Suriname they had to work on under state supervision until 1873. The Boer republics in southern Africa, in lighter orange, were never Dutch: descendants of the Cape's Dutch settlers founded them, and Britain annexed the last two in 1900.
Occupation, Revolution and What Remains, 1942–2026
The map has no frame between 1910 and 8 March 1942, when the colonial army surrendered to Japan and the archipelago turns purple, all but the south of New Guinea around Merauke, which Japan never occupied. On 17 August 1945, two days after Japan's own surrender, Sukarno and Mohammad Hatta proclaimed the Republic of Indonesia. The Netherlands did not recognise it and sent troops; in the violent months that followed (the bersiap) revolutionary bands killed thousands of Indo-Europeans, Dutch, Chinese and others.
In the frame of March 1946 the outer islands are orange again, but Java and Sumatra are magenta, the Republic's colour, with Dutch enclaves around the big cities. On 21 July 1947 the Dutch army attacked out of the enclaves (The Hague called it a 'police action') and occupied the plantation and oil regions, and on 19 December 1948 it took the Republican capital, Yogyakarta. That frame shows Java and Sumatra in orange except Aceh, which the Dutch never reoccupied. Pressed by the UN Security Council and the United States, which threatened to stop Marshall aid, the Netherlands gave way and transferred sovereignty on 27 December 1949. About 100,000 Indonesians and some 5,000 Dutch soldiers had died. A Dutch study of 17 February 2022 concluded that the Dutch forces had used extreme violence structurally, and prime minister Mark Rutte apologised to Indonesia.
Western New Guinea was kept out of the transfer; it went to a UN administration on 1 October 1962 and to Indonesia on 1 May 1963. Suriname became independent on 25 November 1975, and the Netherlands Antilles were dissolved on 10 October 2010. The last frame, dated 24 October 2026, has orange only on the Netherlands and six Caribbean islands. Aruba, Curaçao and Sint Maarten are countries within the Kingdom; Bonaire, Sint Eustatius and Saba are special municipalities of the Netherlands. The last black pin stands in The Hague, where on 19 December 2022 Rutte apologised for the Dutch state's role in slavery; King Willem-Alexander asked forgiveness on 1 July 2023.
How to Read the Map
Orange is Dutch-held land (VOC, WIC or state). Lighter orange marks the Boer republics and Luxembourg in personal union (1815–1890). When land changes hands it briefly takes the new ruler's colour before it fades: red for Britain, blue for France, green for Portugal, teal for Koxinga, purple for Japan, magenta for Indonesia, light blue for the UN, dark green for Suriname and black for Belgium, which broke away in 1830. The legend lists 36 layers by place, from 'Dutch Republic → Kingdom of the Netherlands' to 'Sint Eustatius, Saba & Sint Maarten'; 31 share the one orange.
The 27 pins are blue for voyages of exploration (Hudson, Tasman, Roggeveen), dark red for failed expeditions and disasters and black for slavery, colonial violence and the end of empire. Another 27 small dots mark lesser voyages and wrecks and, in brown, trading posts such as Surat, Mocha and Canton. At world scale most possessions are specks, so zoom in on a region before you press play.
How the Map Was Made
The borders are hand-drawn approximations on modern Natural Earth boundaries, and forts are small circles. The map's source line names Natural Earth and general histories of the VOC and WIC (Gaastra, Den Heijer, Boxer). In November 2026 the black pins were added, with figures checked against the Wikipedia articles on each event, and Java and Sumatra in 1946–49 were redrawn, coarsely, at three moments; New Guinea in 1942–45 is as coarse, with the limit of the Japanese occupation drawn along the central mountain range. After December 1948 Republican guerrillas still held much of the countryside.
The map also has gaps. The Netherlands stays orange through the German occupation of 1940–45, although it turns French blue for the annexation of 1810–13. The East Indies stay in Japan's purple until the frame of March 1946 (New Guinea excepted: the north coast that the Allies retook in 1944 is orange again in the frame of August 1945), although Japan had surrendered in August 1945 and the Republic already governed much of Java. And land that was only claimed has the same orange as land that was governed: western New Guinea is orange from the flag-raising at Fort Du Bus in 1828, but the first lasting administrative posts date from 1898.
Chronological Timeline
- 1596 — First Dutch fleet reaches Banten
- 1602 — VOC founded
- 1621 — WIC founded; Coen depopulates Banda
- 1630–1654 — Dutch Brazil
- 1637 — Elmina taken
- 1652 — Van Riebeeck founds the Cape colony
- 1664 — English seize New Amsterdam
- 1667 — Suriname taken; Peace of Breda
- 1795 — Britain takes the Cape, Malacca and Cochin
- 1814 — Convention of London; slave trade banned
- 1824 — Anglo-Dutch Treaty
- 1830 — Java War ends; Cultivation System begins
- 1863 — Slavery ends in Suriname and the Antilles
- 1942 — Japan occupies the Indies
- 1945 — Indonesia proclaims independence
- 1949 — Sovereignty transferred to Indonesia
- 1962 — West New Guinea handed to the UN
- 1975 — Suriname becomes independent
- 2010 — Netherlands Antilles dissolved
Zoom in on one region, pause on 1641, 1795–1816 and 1946–1949, and open the black pins.
Explore the full interactive map →The rival that took the Cape, Ceylon and Malacca: the British Empire, 1600–1997, on one map.
Read about the British Empire →Frequently asked questions
- Which colonies did the Netherlands have?
- In Asia the Indonesian archipelago (the Dutch East Indies, until 1949), the coast of Ceylon, Malacca, Cochin and Formosa (1624–1662). In Africa the Cape colony (1652–1806), Elmina on the Gold Coast (from 1637) and, from 1641 to 1648, Luanda. In the Americas New Netherland (lost for good in 1674), Dutch Brazil (1630–1654), Suriname (1667–1975), Essequibo, Demerara and Berbice (kept by Britain in 1814) and six Caribbean islands that are still part of the Kingdom of the Netherlands.
- What was the difference between the VOC and the WIC?
- Both were chartered trading companies of the Dutch Republic. The Dutch East India Company (VOC), founded on 20 March 1602, had the monopoly on Dutch trade east of the Cape of Good Hope, with the right to wage war and make treaties in Asia; Jan Pieterszoon Coen founded Batavia on Java for it in 1619. The West India Company (WIC), founded on 3 June 1621, covered West Africa and the Americas: Dutch Brazil, Elmina on the Gold Coast, Curaçao and the Atlantic slave trade. The bankrupt VOC lost its charter on 31 December 1799, and the state took over.
- How many enslaved Africans did Dutch ships carry across the Atlantic?
- Well over half a million, about 5 per cent of the whole Atlantic slave trade: by the estimates of the SlaveVoyages database more than 550,000 people were embarked on Dutch ships and about 475,000 survived the crossing. The Dutch slave trade was banned in 1814. Slavery itself ended in Suriname and on the Dutch Caribbean islands on 1 July 1863, when about 33,000 people in Suriname and about 12,000 on the islands were freed; the owners were compensated, the freed were not, and in Suriname they had to work on under state supervision until 1873.
- Why did the Dutch lose New Amsterdam?
- An English squadron took New Amsterdam in September 1664, and the Peace of Breda of 31 July 1667 let each side keep what it held: England kept New Netherland, and the Dutch Republic kept Suriname, which Abraham Crijnssen had taken in February 1667. A Dutch fleet retook New York in August 1673 and renamed it New Orange, but the Treaty of Westminster gave it back to England in February 1674.
- When did Indonesia become independent from the Netherlands?
- Sukarno and Mohammad Hatta proclaimed the Republic of Indonesia on 17 August 1945, two days after Japan's surrender. The Netherlands did not recognise it and fought a war that included two large offensives, in July 1947 and December 1948, before it transferred sovereignty on 27 December 1949. About 100,000 Indonesians and some 5,000 Dutch soldiers died. Western New Guinea stayed Dutch until 1962 and went to Indonesia on 1 May 1963.
- What is left of the Dutch colonial empire today?
- As of November 2026, six islands in the Caribbean. Aruba, Curaçao and Sint Maarten are countries within the Kingdom of the Netherlands; Bonaire, Sint Eustatius and Saba have been special municipalities of the Netherlands since the Netherlands Antilles were dissolved on 10 October 2010. Suriname became independent on 25 November 1975.
- Is there an animated map of the Dutch colonial empire?
- Yes. Moving Polygons has a free animated world map, The Dutch Colonial World, 1588–today, that follows the Dutch possessions overseas in 113 dated steps, from the Republic of 1588 through the forts of the VOC and WIC, Dutch Brazil, New Netherland, the Cape and the East Indies to the Indonesian revolution of 1945–49 and the Caribbean islands of today. Dutch-held land is orange, and land that changes hands briefly takes the new ruler's colour; 27 pins mark voyages, disasters, slavery and colonial violence. You can watch it, embed it on your own website or export it as an animated GIF.
Text version of the map (timeline, layers and events): Markdown