@chrisjager
Map Creator
Published Maps
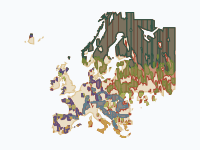
Europe's Forests, 1400–2025
Where Europe's forests stood around 1400, where they were cleared, and what grew back. Colours show forest type; rust shows land that was forest in 1400 and has since been cleared, pale wool shows land whose natural forest was already gone before 1400. This is a reconstruction, not a survey: national forest-cover trajectories (national forest histories; Kaplan, Krumhardt & Zimmermann 2009, 'The prehistoric and preindustrial deforestation of Europe', QSR 28; FAO / Forest Europe statistics for recent decades) are placed on a 0.25° grid by a rule that keeps forest longest in mountains, known forest massifs and land far from historic cities. Forest types are potential natural vegetation; 'planted conifers' marks regrowth and conversion since 1900 in countries where plantations dominate. Treat patterns as indicative, especially before 1800.
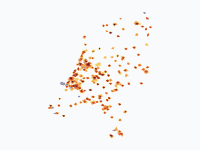
Dutch cities grow, 1300–2025
How the towns and cities of the Netherlands spread across the land, from the walled towns of 1300 to the sprawling urban regions of today. Colours show when each part of a town was built: dark red for the medieval core, through orange to pale yellow for the districts of the last 30 years. Grey-violet marks ports, heavy industry and Schiphol. For five centuries growth was slow and stayed inside town walls. Holland's towns boomed after the fall of Antwerp in 1585 and in the Golden Age, then barely grew for almost 200 years. Only after the Fortress Act of 1874, the railways and industrialisation did cities break out of their ramparts. The real explosion came after 1945: in 80 years the built-up area of the country grew several times over, first as garden cities around the big cities, then as planned growth towns (Zoetermeer, Nieuwegein, Almere, Lelystad) and finally as VINEX districts built right against the existing cities. Method: about 60 cities are drawn district by district, with each named district appearing in the years it was built. About 110 smaller towns are drawn schematically: an old core plus growth rings sized from their population and the typical age of Dutch housing. Pre-1850 town areas follow published hectare figures for walled towns, or population divided by the densities measured on Jacob van Deventer's 16th-century town maps. From 1900 on, each city's footprint is sized as population divided by a period-typical urban density (about 24,000 people per km2 in big cities around 1900, falling to about 7,500 today). Shapes are schematic: positions of districts are accurate to a few hundred metres, outlines are not surveyed boundaries. Villages and many small towns are left out. Sources: J. de Vries, European Urbanization 1500-1800 (1984); J.C. Visser, Dichtheid van de bevolking in de laat-middeleeuwse stad (Tijdschrift voor Historische Geografie, 1985); Monumenten Inventarisatie Project city descriptions (Rijksdienst voor het Cultureel Erfgoed); RCE protected townscape reports; T. Stol on Middelburg and R.J. de Vries on Enkhuizen (THG 1983); R. Rutte on Dutch town populations; CBS population statistics; Wikipedia city histories; Natural Earth for land, lakes and rivers.
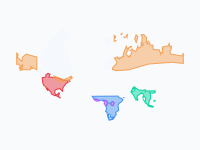
Where elephants and mammoths lived, 21,000 years ago to today
Where elephants and their mammoth cousins lived in the wild, from the peak of the last Ice Age (~21,000 years ago) to today. Colours show species; white shows the ice sheets. During the Ice Age, sea level was ~120 m lower, so some ranges extend over what was then dry land (the Bering land bridge, the North Sea, the Sunda Shelf). Highlights: woolly mammoths shrank from a range spanning Europe, northern Asia and North America to two small islands (St Paul, ~5,600 years ago; Wrangel, ~4,000 years ago). Columbian and pygmy mammoths vanished ~13,000–12,500 years ago. Asian elephants once lived from Syria and the Yellow River to Java; today they hold perhaps 15% of that range. African elephants occupied almost all of Africa south of the Sahara (and the Sahara itself when it was green) until the ivory trade and farming fragmented their range from the 1800s on. Note on the timeline: the map tool cannot store dates before 4713 BC, so the five Ice Age frames (21,000 to 9,000 years ago) are squeezed into 4700–4300 BC on the time slider. Their labels give the real ages. Ranges are hand-drawn approximations at continental scale, not survey data: prehistoric ranges come from dated fossils and climate models; historical ranges from written records; recent ranges are generalised from the African Elephant Database and IUCN maps. Ice-age coastlines are approximated with the 200 m depth contour. Main sources: Stuart et al. 2004 (Nature) and Stuart 2005; Nogués-Bravo et al. 2008 (PLoS Biology); Nadachowski et al. 2018 (Quaternary Research); Graham et al. 2016 (PNAS, St Paul Island); Vartanyan et al. (Wrangel Island); Dyke 2004 and Hughes et al. 2016 (ice sheets); Elvin 2004, The Retreat of the Elephants, and Wen Huanran (China); Çakırlar & Ikram 2016 (Syrian elephants); Sukumar 2003, The Living Elephants; de Silva et al. 2023 (Scientific Reports, Asian elephant habitat since 1700); Thouless et al. 2016, African Elephant Status Report (IUCN); Douglas-Hamilton 1987 (1979–1987 African elephant numbers).